Date: Wed, July 16, 2025 | 05:40 PM GMT
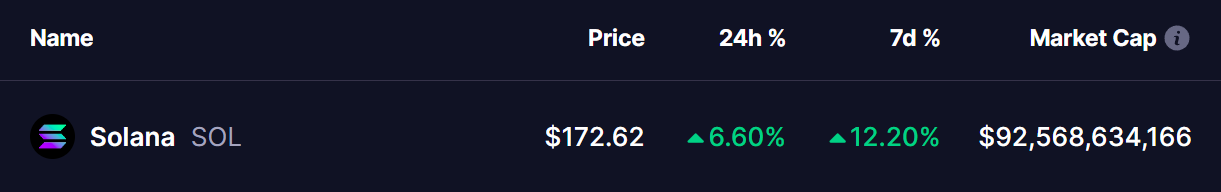
The cryptocurrency market remains strongly bullish, with Ethereum (ETH) maintaining its impressive upside momentum—posting a 6% daily gain and now approaching the $3,300 mark. This bullishness is spilling over into major altcoins, and Solana (SOL) is now emerging as a coin to watch.
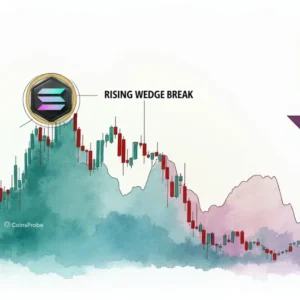
SOL has jumped 6% today, extending its weekly gains to 12%, but what’s catching even more attention now is the formation of a textbook harmonic ABCD pattern on the daily chart — a technical structure often used to predict trend continuations.
Harmonic Pattern Hints at Bullish Continuation
Looking at the daily timeframe, SOL is forming a Bearish ABCD harmonic pattern, which despite its name, typically predicts bullish continuation during its CD leg. The pattern began in April from point A at $95.26, followed by a rally to point B, then a pullback to point C near $126.29 in late June.
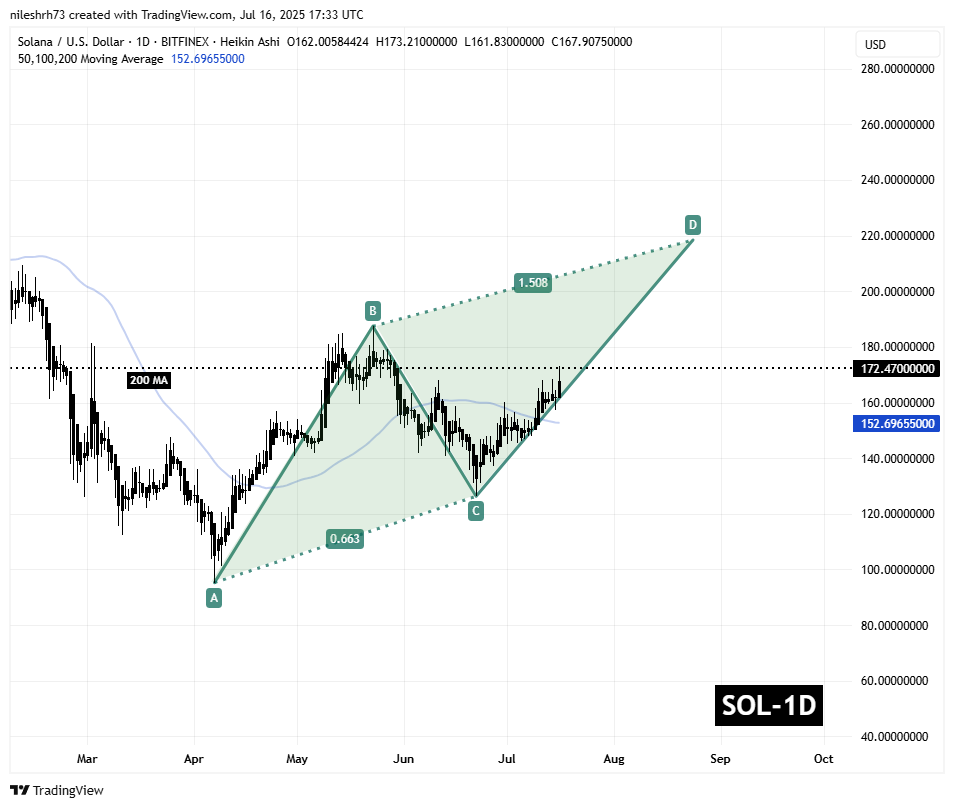
Since establishing point C, Solana has reversed with strength, climbing to around $172.47. If the ABCD pattern plays out fully, the final leg — from point C to point D — could see price heading toward the 1.50 Fibonacci extension, which aligns with a target near $218.43.
What’s Next for SOL?
If this bullish setup unfolds as expected, Solana could gain another 26%, reaching the Potential Reversal Zone (PRZ) at $218.43 — a region that mirrors the AB leg in length, per harmonic theory. This area may act as final resistance, where some traders could start locking in profits.
To confirm the pattern, SOL must continue to hold above the 200-day moving average at around $152.69, which now acts as a key support level. A sustained move above this line will reinforce the bullish momentum and help validate the ongoing harmonic structure.
With broader crypto sentiment still favoring upside and SOL forming a well-defined harmonic pattern, this altcoin remains one of the top technical setups to watch in the coming sessions.
Disclaimer: This article is for informational purposes only and does not constitute financial advice. Always perform your own due diligence before making investment decisions in the cryptocurrency market.

The opinions and market insights shared on CoinsProbe represent the views of individual authors based on prevailing market conditions at the time of publication. Cryptocurrency investments carry significant risk and volatility. Readers are encouraged to conduct their own research and seek professional financial advice before making investment decisions. CoinsProbe and its contributors do not accept responsibility for financial losses or decisions made based on published content.
CoinsProbe may publish sponsored articles, affiliate links, or promotional collaborations. All sponsored material is clearly labeled to maintain transparency with our audience. Our editorial decisions remain fully independent, and advertising partnerships do not influence reviews, rankings, or published opinions.
Since 2023, CoinsProbe has delivered reliable insights on cryptocurrency, blockchain, and digital assets. Our content is created by experienced researchers and analysts who follow strict editorial standards focused on accuracy, transparency, and credibility. Every article is carefully reviewed and verified using trusted sources and current market data. We provide unbiased analysis and timely updates covering everything from emerging crypto projects to major industry developments.