
Key Takeaways
- Solana (SOL) is under short-term pressure as the broader crypto market faces heavy liquidation-driven selling.
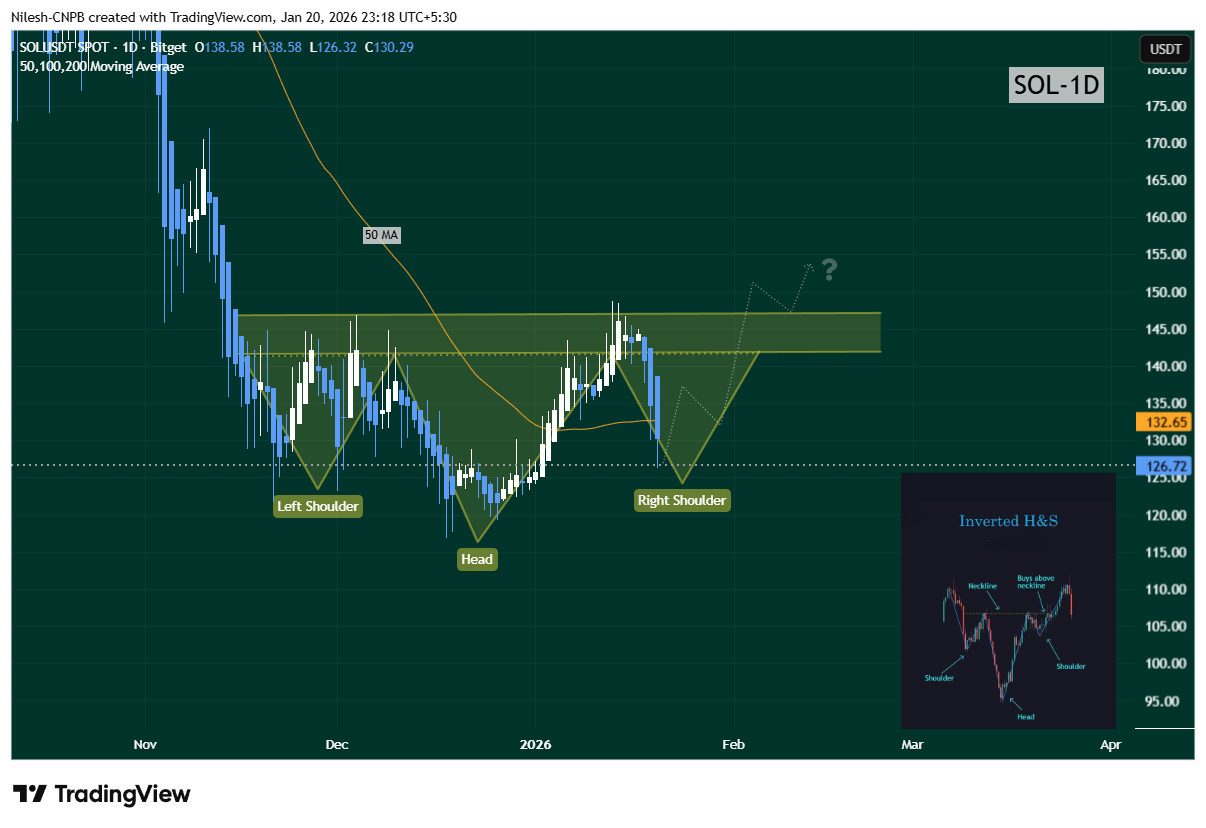
- The daily chart suggests a potential inverted head and shoulders pattern, a classic bullish reversal structure.
- The $123 zone is acting as a critical support area where buyers have previously stepped in.
- SOL remains below the 50-day moving average near $132.65, which is a key resistance level for bulls.
- A reclaim of the 50-day MA could open the door for a move toward the $142–$147 neckline resistance.
- A breakdown below the $126–$121 region would invalidate the bullish setup and increase downside risk.
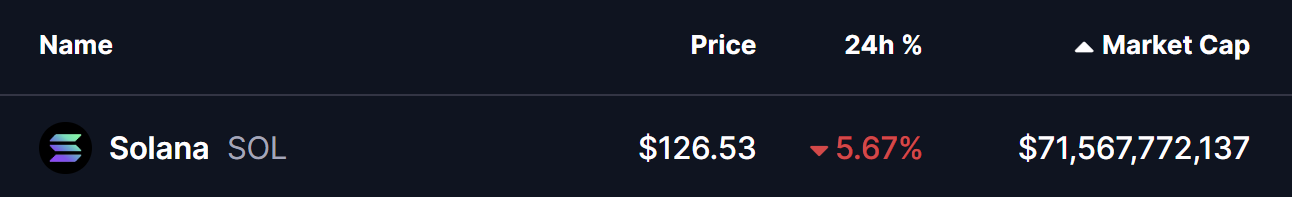
Solana (SOL) is trading in the red as the broader crypto market remains under pressure over the past 48 hours. Risk sentiment has turned cautious once again, with Bitcoin (BTC) slipping below the $90,000 mark and Ethereum (ETH) tumbling nearly 7% in the last 24 hours. This sharp move triggered more than $689 million in liquidations, with long positions accounting for roughly $629 million of the damage.
Amid this market-wide sell-off, SOL has dropped over 5%. However, beneath the red candles, Solana’s daily chart is beginning to hint at a potential technical setup that could shape its next move.
Emerging Inverted Head and Shoulders Pattern
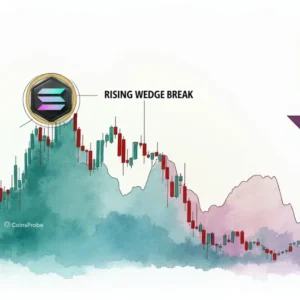
On the daily timeframe, Solana appears to be forming a possible inverted head and shoulders pattern, one of the more reliable bullish reversal structures when confirmed.
- The left shoulder formed in late November around the $123 zone.
- Price then sold off more deeply to create the head near $119, marking a local capitulation low.
- The latest rejection from the neckline resistance zone between $142 and $147 has pushed SOL lower again, with price now drifting back toward the $123 area. This move is shaping what could become the right shoulder.
This structure suggests that sellers may be losing momentum after repeated attempts to push price lower, while buyers continue to defend the same demand zone.
Key Resistance Still Overhead
Despite the developing pattern, SOL is still trading below its 50-day moving average, currently positioned near $132.65. This moving average has flipped into a key overhead resistance and remains a crucial level for bulls to reclaim. As long as SOL stays below this line, upside attempts may struggle to gain traction.
What’s Next for SOL?
If the inverted head and shoulders pattern continues to develop, SOL could find support near the $123 region, completing the right shoulder and setting the stage for a rebound. A successful push back above the 50-day moving average would be an early bullish signal and could open the door for a renewed move toward the neckline resistance zone at $142–$147.
A decisive breakout above this neckline sees the pattern confirmed and could trigger a short-term bullish rally as momentum traders step back in.
On the flip side, the bullish setup remains vulnerable. A breakdown below the $126–$121 support zone would invalidate the inverted head and shoulders structure and increase the risk of further downside.
Outlook
For now, Solana sits at a technical crossroads. While broader market weakness continues to weigh on price, the developing chart structure suggests that selling pressure may be fading. Traders will be watching closely to see whether SOL can hold the $123 support and reclaim the 50-day moving average — a move that could turn this dip into a potential rebound opportunity.
Disclaimer: The views and analysis presented in this article are for informational purposes only and reflect the author’s perspective, not financial advice. Technical patterns and indicators discussed are subject to market volatility and may or may not yield the anticipated results. Investors are advised to exercise caution, conduct independent research, and make decisions aligned with their individual risk tolerance.
About Author: Nilesh Hembade is the Founder and Lead Author of Coinsprobe, with over 5 years of experience in the cryptocurrency and blockchain industry. Since launching Coinsprobe in 2023, he has been providing daily, research-driven insights through in-depth market analysis, on-chain data, and technical research.

The opinions and market insights shared on CoinsProbe represent the views of individual authors based on prevailing market conditions at the time of publication. Cryptocurrency investments carry significant risk and volatility. Readers are encouraged to conduct their own research and seek professional financial advice before making investment decisions. CoinsProbe and its contributors do not accept responsibility for financial losses or decisions made based on published content.
CoinsProbe may publish sponsored articles, affiliate links, or promotional collaborations. All sponsored material is clearly labeled to maintain transparency with our audience. Our editorial decisions remain fully independent, and advertising partnerships do not influence reviews, rankings, or published opinions.
Since 2023, CoinsProbe has delivered reliable insights on cryptocurrency, blockchain, and digital assets. Our content is created by experienced researchers and analysts who follow strict editorial standards focused on accuracy, transparency, and credibility. Every article is carefully reviewed and verified using trusted sources and current market data. We provide unbiased analysis and timely updates covering everything from emerging crypto projects to major industry developments.