
- Shiba Inu (SHIB) is showing signs of repeating a historic fractal pattern on the weekly chart that previously preceded a major bullish rally.
- The current structure mirrors the earlier cycle with a breakdown below $0.00001763, loss of the 50 and 100-week MAs, and nearly 392 days of consolidation.
- SHIB is currently holding a key accumulation support zone between $0.0000050 and $0.0000068, the same range that triggered the last reversal.
- A reclaim of the 100-week MA near $0.00001071 and the $0.00001763 resistance could signal the start of a new bullish expansion if the fractal continues to play out.
Shiba Inu, the popular dog-themed memecoin, is beginning to show early signs of momentum despite the broader consolidation across the memecoin sector as of March 13, 2026.
At the time of writing, SHIB is trading near $0.00000596 ($0.0₅596) after gaining around 4.00% in the past 24 hours. Over a longer timeframe, the token remains relatively subdued, posting a 1.81% gain in the past 30 days while still down 28.60% over the past 90 days.
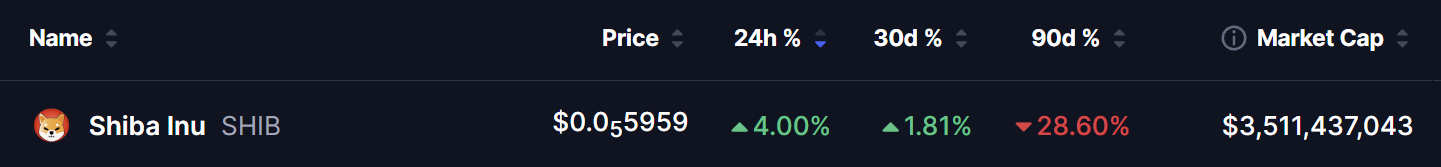
The token currently holds a market capitalization of roughly $3.51 billion, keeping it among the largest cryptocurrencies in the memecoin category.
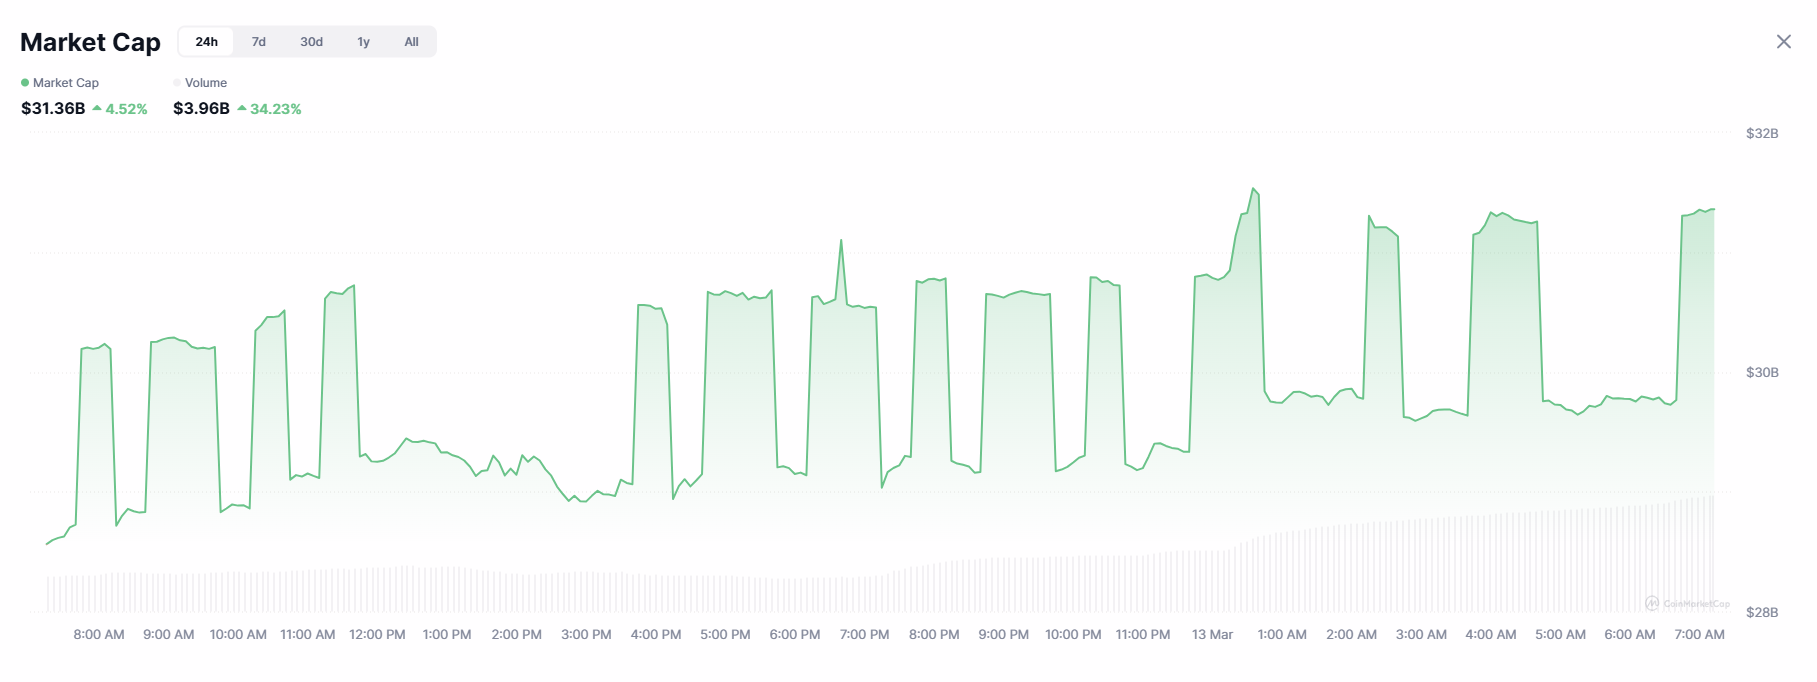
Meanwhile, the broader memecoin market is also showing signs of renewed activity. The total memecoin market cap has climbed 4.52% to $31.36 billion, while 24-hour trading volume surged 34.23% to $3.96 billion, signaling increased participation from traders.
SHIB Mirrors Historic Fractal
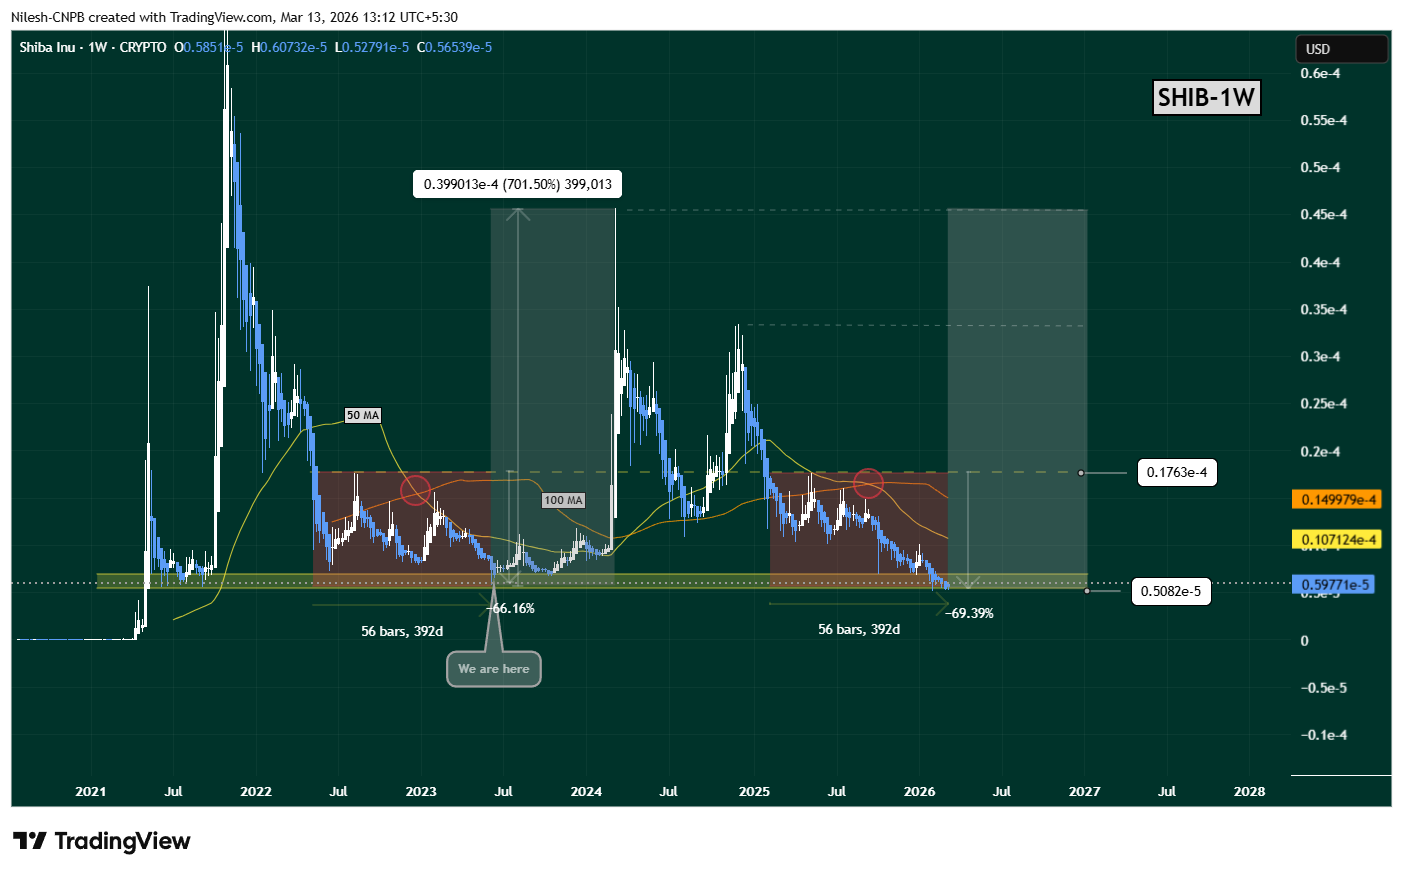
A closer look at the weekly timeframe reveals that SHIB appears to be following a fractal pattern strikingly similar to its previous market cycle, which was first highlighted on charts back in June 2023.
During the previous cycle, after a powerful rally, SHIB entered a deep correction phase. The token broke below the key support level near $0.0000176300 while also losing both the 50-week and 100-week moving averages.
This breakdown triggered a prolonged bearish period that pushed the price into a bottom range between $0.0000050 and $0.0000068. The token then spent roughly 392 days consolidating in this zone, forming what later proved to be a major accumulation range.
During that period, SHIB experienced an approximate 66% correction before eventually reclaiming both moving averages and breaking back above the $0.0000176300 resistance level. That breakout ultimately ignited a massive bullish rally of nearly 700%.
Interestingly, the current market structure is showing several similarities to that earlier cycle.
The chart highlights the following parallels:
- Breakdown below the $0.0000176300 key level
- Loss of both the 50-week and 100-week moving averages
- A nearly identical 392-day consolidation phase
- A ~69% correction from the previous local high
These similarities suggest that SHIB may currently be repeating the same accumulation structure seen before its previous explosive rally.
What’s Next for SHIB?
At the moment, SHIB continues to respect the critical support zone between $0.0000050 and $0.0000068, which previously served as the base for the last bullish reversal.
If this support level continues to hold and the fractal structure plays out again, the first major confirmation of strength would be a reclaim of the 100-week moving average near $0.00001071.
Such a move could signal the start of a broader trend reversal and potentially push the price toward the 50-week moving average and the key resistance level around $0.0000176300.
A breakout above that level would represent a major technical shift and could open the door for a larger bullish expansion, similar to the previous cycle.
Key Risk to Watch
While fractal patterns can provide valuable insights into market behavior, they are not guaranteed to repeat.
If SHIB fails to hold the $0.0000050–$0.0000068 support zone, the fractal setup could become invalid. A breakdown below this range may expose the token to further downside pressure and delay any potential recovery phase.
For now, however, traders are closely watching whether SHIB’s current structure will mirror its previous accumulation cycle — one that ultimately led to a massive rally.

The opinions and market insights shared on CoinsProbe represent the views of individual authors based on prevailing market conditions at the time of publication. Cryptocurrency investments carry significant risk and volatility. Readers are encouraged to conduct their own research and seek professional financial advice before making investment decisions. CoinsProbe and its contributors do not accept responsibility for financial losses or decisions made based on published content.
CoinsProbe may publish sponsored articles, affiliate links, or promotional collaborations. All sponsored material is clearly labeled to maintain transparency with our audience. Our editorial decisions remain fully independent, and advertising partnerships do not influence reviews, rankings, or published opinions.
Since 2023, CoinsProbe has delivered reliable insights on cryptocurrency, blockchain, and digital assets. Our content is created by experienced researchers and analysts who follow strict editorial standards focused on accuracy, transparency, and credibility. Every article is carefully reviewed and verified using trusted sources and current market data. We provide unbiased analysis and timely updates covering everything from emerging crypto projects to major industry developments.