Date: Tue, Nov 18, 2025 | 07:40 AM GMT
The broader crypto market continues to face heavy selling pressure as both Bitcoin (BTC) and Ethereum (ETH) have dropped more than 5% in the last 24 hours. This sharp decline has weighed significantly on major altcoins, and Sei (SEI) is no exception.
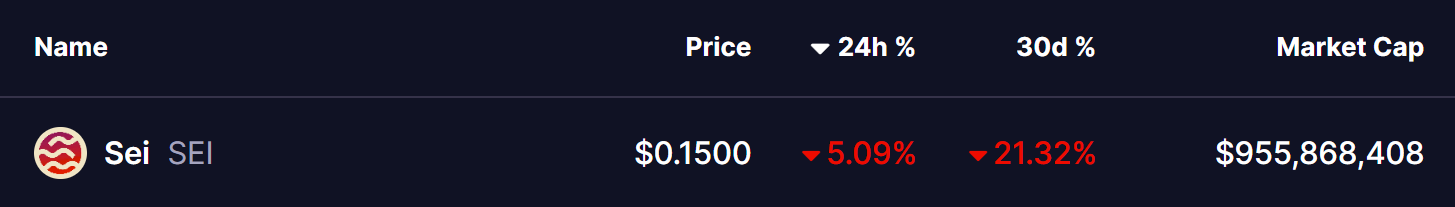
SEI has fallen over 5% today, extending its monthly loss to more than 21%. More importantly, the latest technical structure suggests that the token may be preparing for a deeper downside move.
Fractal Setup Hints at Further Downside
On the weekly chart, SEI is currently trading inside a massive falling wedge structure that has governed its price action since early 2024. What makes this setup more compelling is that SEI appears to be repeating an almost identical fractal pattern that triggered multiple large corrections in the past.
In both April 2024 and February 2025, SEI faced rejection from the upper resistance trendline of the wedge. Following each rejection, the token broke below key support zones (marked in red and green) and suffered sharp 81% corrections that drove the price back toward the wedge’s lower boundary before staging a temporary recovery.
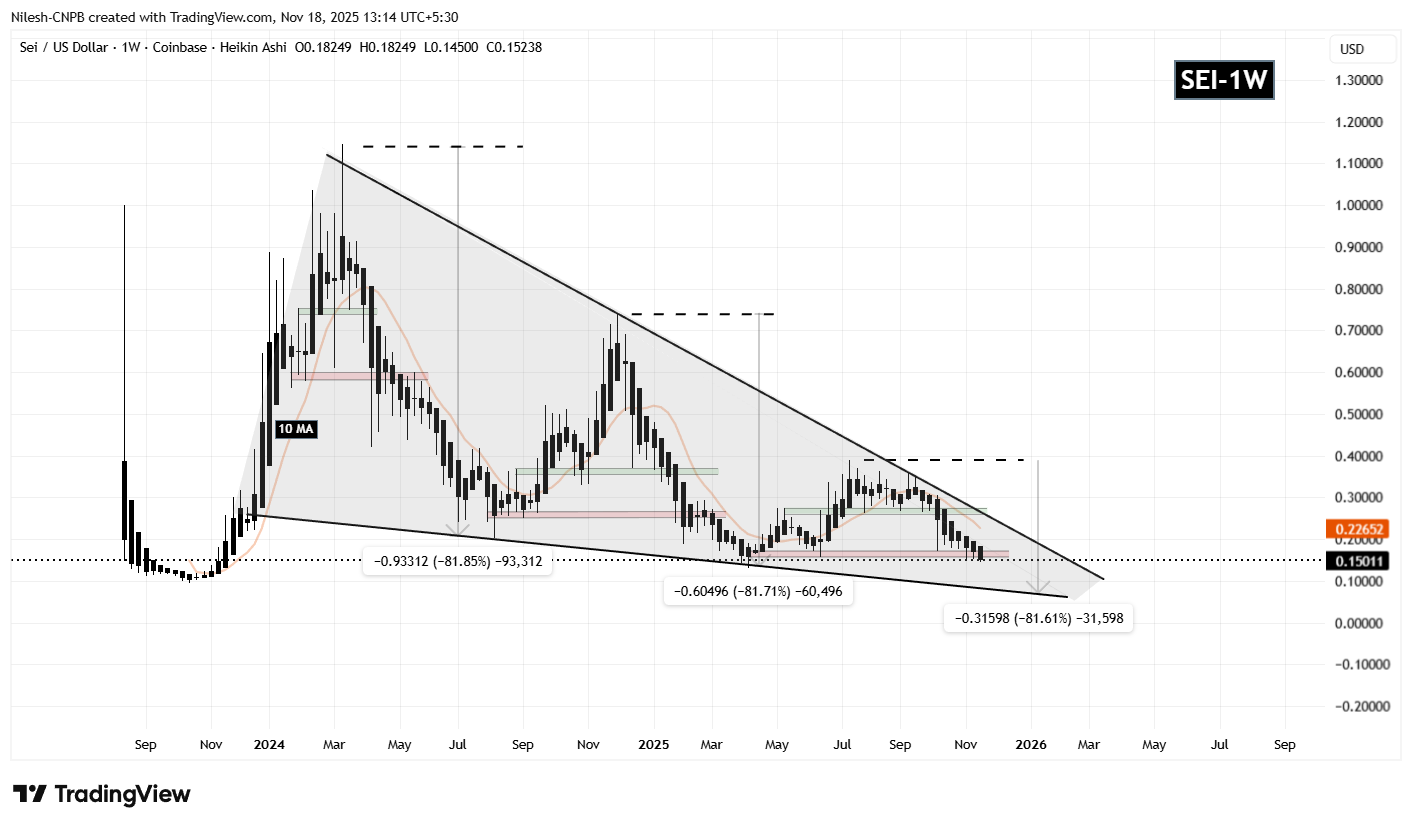
The chart now shows SEI repeating the same behavior.
After its recent rejection from the upper resistance trendline near $0.3576, the token has once again slipped below both support zones. SEI is currently trading in the $0.15–$0.14 range — the same position it took in previous 81% declines.
With the fractal aligning almost perfectly, the technical setup suggests that SEI may be preparing for another substantial leg down.
What’s Next for SEI?
Since SEI has failed to hold the red-zone support at $0.1582, the bearish fractal outlook remains intact. If the pattern continues to play out, the token could face another correction of approximately 81%, which would push the price toward the lower boundary of the wedge — around the $0.071 region. From current levels, this represents an additional 52% potential downside.
However, there is a key level that could invalidate this bearish setup. If SEI manages a strong bounce and reclaims the 10-week moving average at $0.2265, it may signal early signs of recovery and break the repeating fractal structure.
Until then, the prevailing technical pressure indicates that SEI may still have room to fall before any meaningful bullish reversal can develop.
Disclaimer: The views and analysis presented in this article are for informational purposes only and reflect the author’s perspective, not financial advice. Technical patterns and indicators discussed are subject to market volatility and may or may not yield the anticipated results. Investors are advised to exercise caution, conduct independent research, and make decisions aligned with their individual risk tolerance.

The opinions and market insights shared on CoinsProbe represent the views of individual authors based on prevailing market conditions at the time of publication. Cryptocurrency investments carry significant risk and volatility. Readers are encouraged to conduct their own research and seek professional financial advice before making investment decisions. CoinsProbe and its contributors do not accept responsibility for financial losses or decisions made based on published content.
CoinsProbe may publish sponsored articles, affiliate links, or promotional collaborations. All sponsored material is clearly labeled to maintain transparency with our audience. Our editorial decisions remain fully independent, and advertising partnerships do not influence reviews, rankings, or published opinions.
Since 2023, CoinsProbe has delivered reliable insights on cryptocurrency, blockchain, and digital assets. Our content is created by experienced researchers and analysts who follow strict editorial standards focused on accuracy, transparency, and credibility. Every article is carefully reviewed and verified using trusted sources and current market data. We provide unbiased analysis and timely updates covering everything from emerging crypto projects to major industry developments.