
Date: Wed, Jan 08, 2025, 06:15 AM GMT
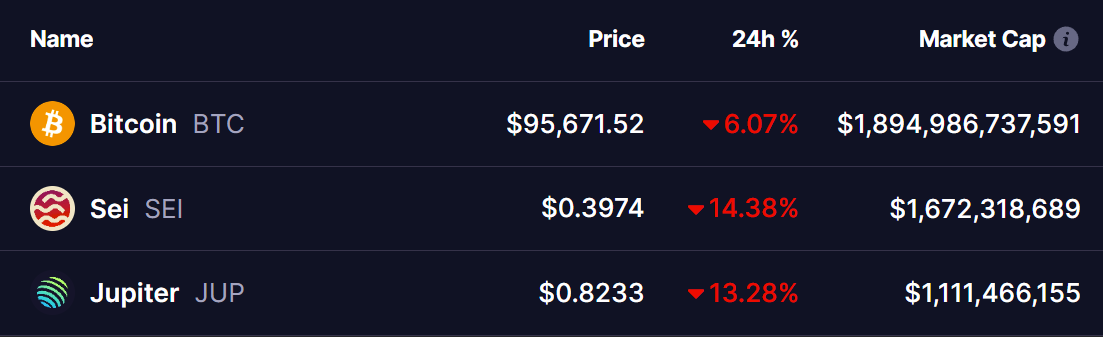
The cryptocurrency market has faced a significant downturn over the past 24 hours, with Bitcoin (BTC) dropping over 6%. This sharp decline triggered liquidations totaling $648 million, according to Coinglass. BTC dominance has also surged, rising above 58.15% from yesterday’s low of 57.52%.
This shift has contributed to notable declines in major altcoins, including Sei (SEI) and Jupiter (JUP), both of which experienced double-digit losses, pushing them to key support levels.
Sei (SEI)
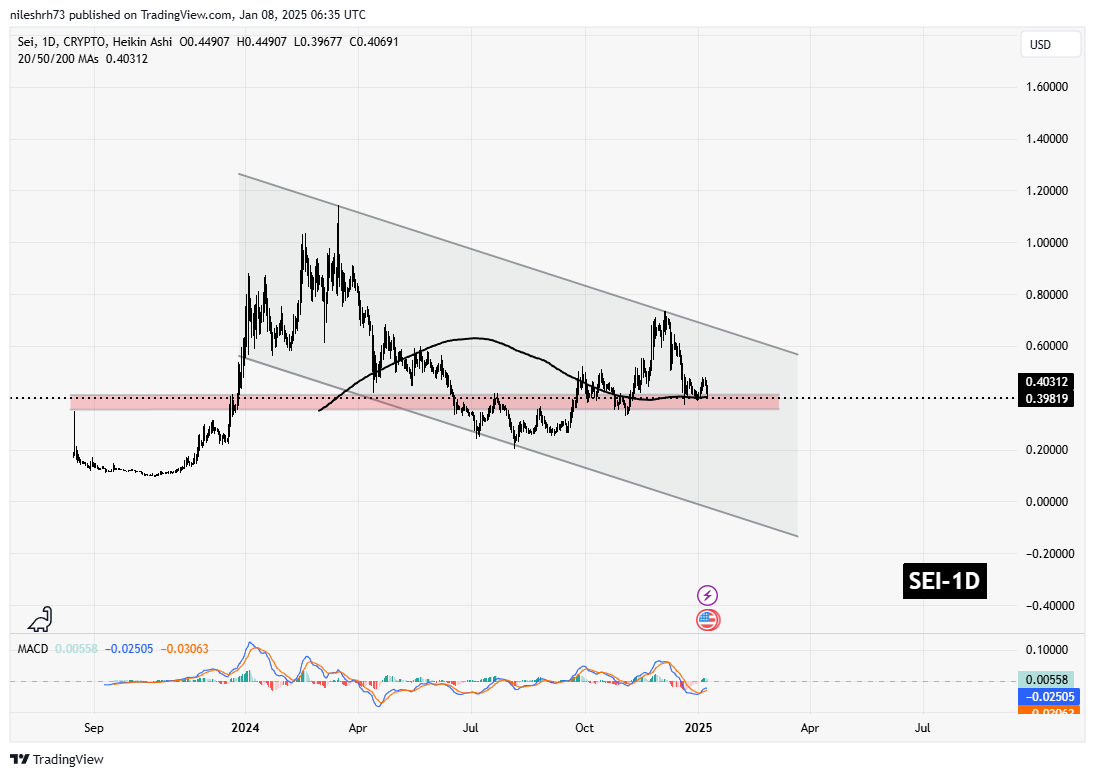
SEI is consolidating in a descending parallel channel, reflecting a broader downtrend that has persisted since its peak near $1.14 in March 2024. The recent drop pushed SEI’s price from $0.48 to its current level of $0.3987, landing within an important demand zone between $0.36 and $0.41. Historically, this zone has acted as a strong rebound level.
Currently, SEI is trading just above its 200-day moving average (200MA), which is sitting at approximately $0.40. This technical level is critical, acting as a pivotal support that could define SEI’s short-term trajectory.
What to Watch For:
- If SEI manages to hold above the 200MA and bounce, it may indicate that buyers are stepping in. This could lead to a potential reversal or a short-term rally toward the next resistance level at $0.48.
- However, a breakdown below this level could open the door to further declines, possibly testing lower levels in the channel.
The MACD (Moving Average Convergence Divergence) indicator is showing signs of a potential crossover. A bullish crossover at this point could confirm upward momentum, signaling the likelihood of a recovery.

Jupiter (JUP)
Jupiter (JUP) is consolidating within a symmetrical triangle pattern, a structure that often precedes significant price movements. After the recent dip, JUP’s price fell from $0.98 to $0.82, a critical support level at the lower boundary of the triangle.
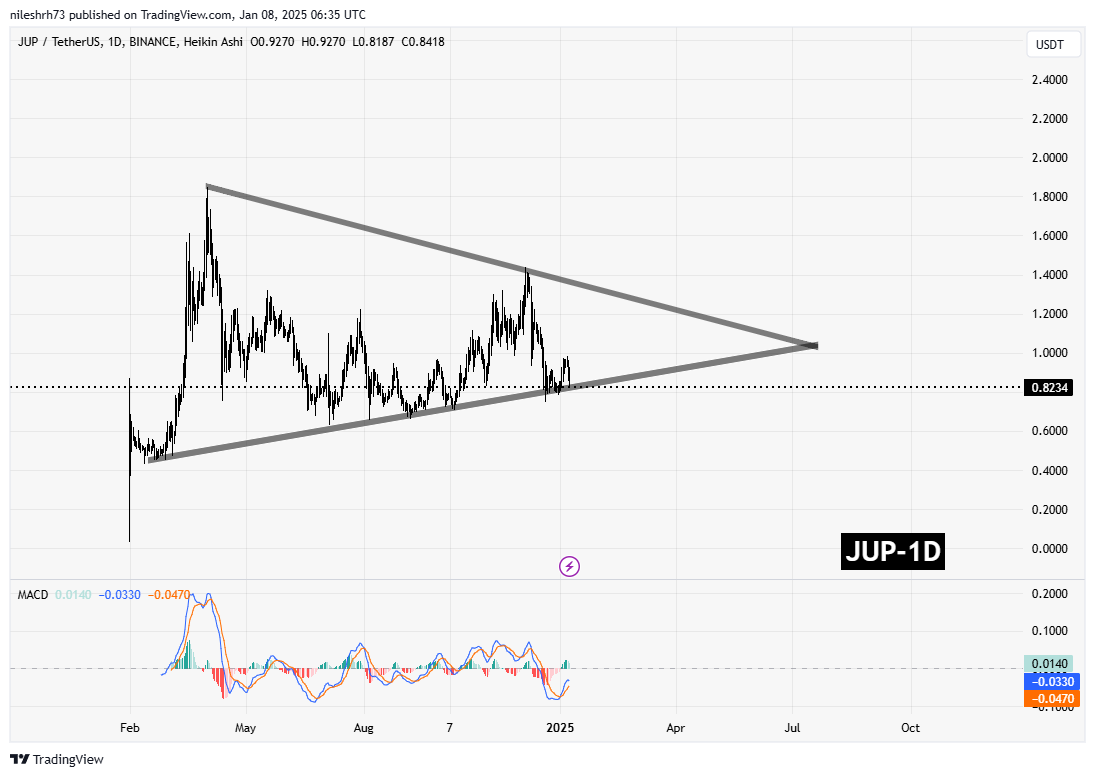
Historically, this support zone has acted as a springboard for price rebounds, and the current price action suggests a potential setup for a breakout or breakdown depending on market momentum.
What to Watch For:
- If JUP holds the triangle’s lower support and bounces, it could lead to a short-term rally, with the first key resistance near $0.98. Breaking out of the triangle to the upside would be a strong bullish signal, potentially targeting higher levels like $1.20.
- Conversely, a breakdown below the triangle could indicate further weakness, leading to a retest of lower levels.
The MACD for JUP is beginning to stabilize, and a bullish crossover would align with a potential bounce, adding strength to the argument for a recovery.
Conclusion
Both SEI and JUP are at pivotal support levels that could determine their short-term price movements. SEI’s position near the 200MA and within a demand zone highlights the importance of this technical juncture. Similarly, JUP’s symmetrical triangle pattern is narrowing, signaling an impending breakout or breakdown.
With market volatility on the rise, these levels warrant close observation for traders and investors looking for opportunities.

Disclaimer: This article is for informational purposes only and not financial advice. Always conduct your own research before investing in cryptocurrencies.

The opinions and market insights shared on CoinsProbe represent the views of individual authors based on prevailing market conditions at the time of publication. Cryptocurrency investments carry significant risk and volatility. Readers are encouraged to conduct their own research and seek professional financial advice before making investment decisions. CoinsProbe and its contributors do not accept responsibility for financial losses or decisions made based on published content.
CoinsProbe may publish sponsored articles, affiliate links, or promotional collaborations. All sponsored material is clearly labeled to maintain transparency with our audience. Our editorial decisions remain fully independent, and advertising partnerships do not influence reviews, rankings, or published opinions.
Since 2023, CoinsProbe has delivered reliable insights on cryptocurrency, blockchain, and digital assets. Our content is created by experienced researchers and analysts who follow strict editorial standards focused on accuracy, transparency, and credibility. Every article is carefully reviewed and verified using trusted sources and current market data. We provide unbiased analysis and timely updates covering everything from emerging crypto projects to major industry developments.