Date: Tue, Nov 19, 2024, 03:46 PM GM
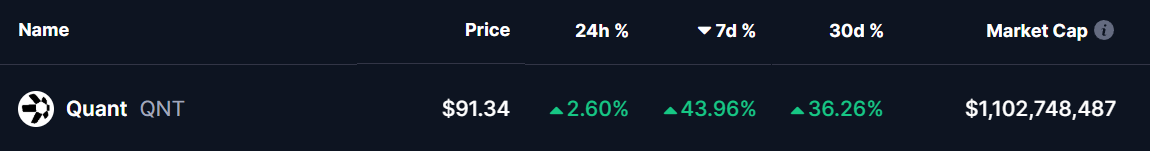
The cryptocurrency market has entered a bullish phase, with altcoins gaining significant momentum following a broader market rally that began on November 5, driven by the recent U.S. election results. Bitcoin (BTC) has reached a new all-time high of $93,434, fueling optimism across the market. Among the top-performing altcoins, Quant (QNT) has captured attention by posting over 40% gains in the past week, currently trading at $91.34 with a market capitalization surpassing $1 billion.
Key Breakout Ahead:
The ongoing rally in Quant (QNT) brings it closer to a critical resistance level, setting the stage for a potential breakout.
1H Chart Analysis
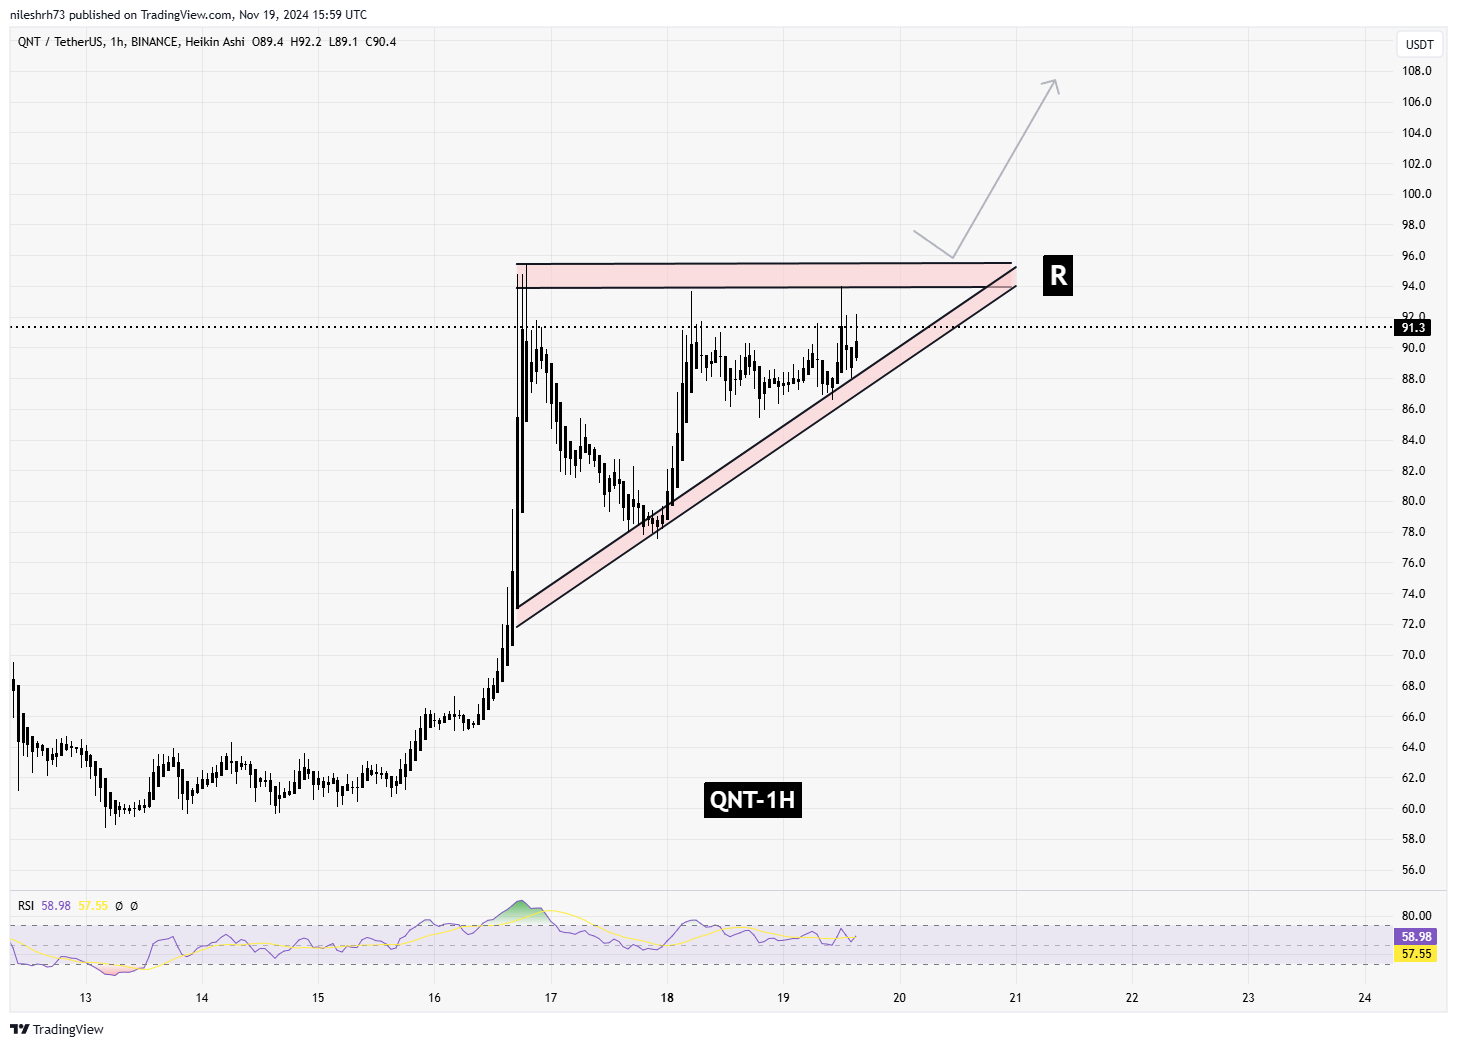
Quant’s hourly chart reveals an ascending triangle formation, a bullish continuation pattern, with a key breakout level at $95.5. The price is consolidating within this structure, forming higher lows and testing the upper resistance multiple times. A breakout above $95.5, accompanied by strong trading volume, could confirm the bullish sentiment and lead QNT toward its next target of $100–$108, as indicated by the measured move of the pattern.
The RSI (Relative Strength Index) on the 1-hour chart remains neutral-to-bullish, suggesting that there is room for the price to rally without entering overbought territory. Traders should watch for volume spikes during the test of $95.5 to validate a breakout.

1W Chart Analysis
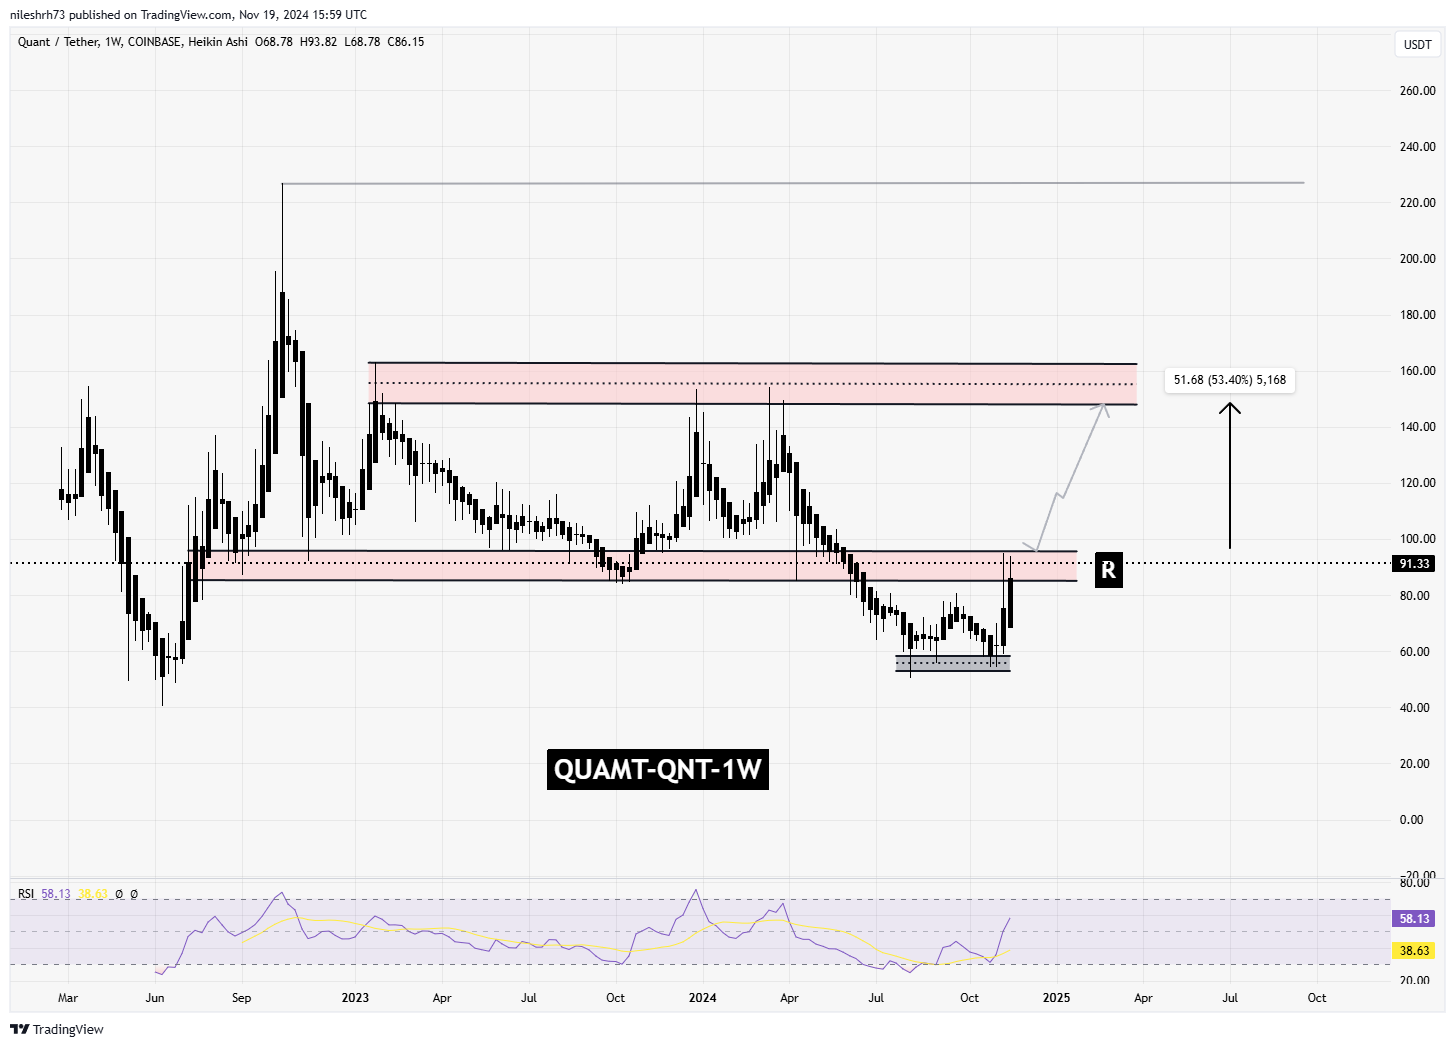
On the weekly timeframe, QNT has surged from the $60–$65 support zone, which has historically been a strong demand area. The current rally has brought the price near the $95.5 breakout zone, a significant resistance level that has previously acted as a barrier to upward movement.
If QNT successfully breaks above $95.5 on the weekly chart, it could trigger a broader rally targeting the $140–$160 range. This move would represent a potential upside of over 53%. The weekly RSI has shifted into bullish territory, further strengthening the case for a sustained rally if the resistance is breached.
Is A Rally On Horizon?
With $95.5 as the pivotal breakout level across both the hourly and weekly charts, Quant (QNT) is showing strong signs of bullish momentum. A decisive move above this level could unlock significant upside potential, targeting the $100–$108 range in the short term and $140–$160 in the longer term. However, failure to break this resistance could result in temporary consolidation or a pullback to the support zones.
As always, traders should remain cautious and monitor market conditions closely, as unexpected changes in sentiment or macroeconomic factors could influence QNT’s price action.
Disclaimer: This article is for informational purposes only and does not constitute financial advice. Always conduct your own research and consult with a professional before making investment decisions.

The opinions and market insights shared on CoinsProbe represent the views of individual authors based on prevailing market conditions at the time of publication. Cryptocurrency investments carry significant risk and volatility. Readers are encouraged to conduct their own research and seek professional financial advice before making investment decisions. CoinsProbe and its contributors do not accept responsibility for financial losses or decisions made based on published content.
CoinsProbe may publish sponsored articles, affiliate links, or promotional collaborations. All sponsored material is clearly labeled to maintain transparency with our audience. Our editorial decisions remain fully independent, and advertising partnerships do not influence reviews, rankings, or published opinions.
Since 2023, CoinsProbe has delivered reliable insights on cryptocurrency, blockchain, and digital assets. Our content is created by experienced researchers and analysts who follow strict editorial standards focused on accuracy, transparency, and credibility. Every article is carefully reviewed and verified using trusted sources and current market data. We provide unbiased analysis and timely updates covering everything from emerging crypto projects to major industry developments.