Date: Tue, Aug 05, 2025 | 06:24 AM GMT
The cryptocurrency market is making a slight recovery from the latest sharp decline as the price of Ethereum (ETH) has bounced to $3675 from its recent low of $3357. Following this rebound, several altcoins have started moving higher — including Polygon (POL).
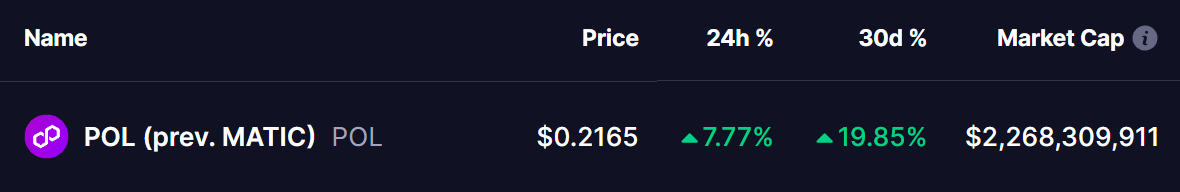
POL has returned to the green today with 7% daily gains, extending its monthly rally to 19%. Its chart is now displaying a key harmonic formation that could point to more upside ahead.
Harmonic Pattern Hints at Potential Bounce
On the daily chart, POL is shaping a Bearish ABCD harmonic pattern — a setup that, despite its name, can involve a strong bullish CD-leg before the final Potential Reversal Zone (PRZ) is reached.
The pattern began with a rally from Point A near $0.1633 to Point B, followed by a retracement to Point C around $0.1898, where buyers stepped back in. Since then, POL has rebounded and is now trading near $0.2161, indicating that the CD leg is underway.
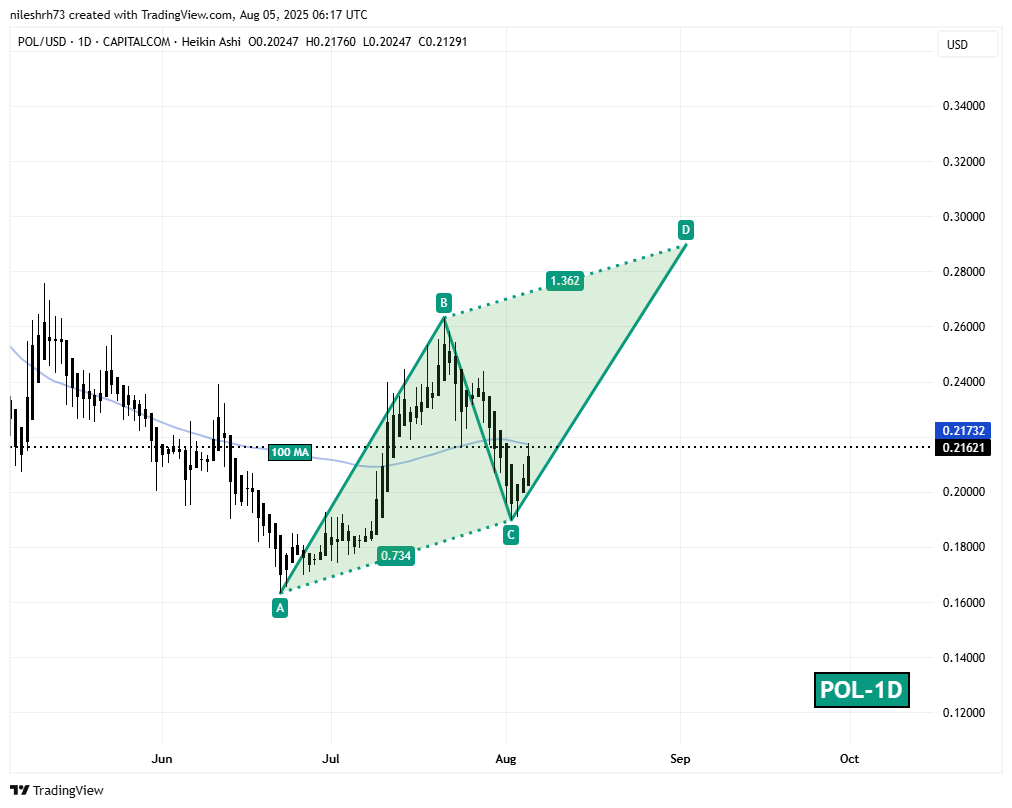
The 1.36 Fibonacci extension of the BC leg — marking Point D — sits around $0.2896, which is the key target bulls are watching. Adding strength to the bullish case, POL is nearing the 100-day moving average (100 MA) at $0.2173. A decisive breakout above this resistance could validate the pattern and attract more momentum-driven buying.
What’s Next for POL?
A sustained move above the 100-day MA could serve as a launchpad toward the PRZ at $0.2896, representing more than a 33% potential upside from current levels. However, if the price fails to hold above the C-leg support near $0.1898, the harmonic structure could be invalidated, exposing the token to renewed selling pressure.
Disclaimer: This article is for informational purposes only and not financial advice. Always conduct your own research before investing in cryptocurrencies.

The opinions and market insights shared on CoinsProbe represent the views of individual authors based on prevailing market conditions at the time of publication. Cryptocurrency investments carry significant risk and volatility. Readers are encouraged to conduct their own research and seek professional financial advice before making investment decisions. CoinsProbe and its contributors do not accept responsibility for financial losses or decisions made based on published content.
CoinsProbe may publish sponsored articles, affiliate links, or promotional collaborations. All sponsored material is clearly labeled to maintain transparency with our audience. Our editorial decisions remain fully independent, and advertising partnerships do not influence reviews, rankings, or published opinions.
Since 2023, CoinsProbe has delivered reliable insights on cryptocurrency, blockchain, and digital assets. Our content is created by experienced researchers and analysts who follow strict editorial standards focused on accuracy, transparency, and credibility. Every article is carefully reviewed and verified using trusted sources and current market data. We provide unbiased analysis and timely updates covering everything from emerging crypto projects to major industry developments.