Date: Tue, April 22, 2025 | 07:05 AM GMT
The cryptocurrency market has been under intense selling pressure recently, with Ethereum (ETH) posting its worst Q1 since 2018, sliding more than 45%. That bearish wave swept across the altcoins — and the Polygon (POL) token wasn’t spared either.
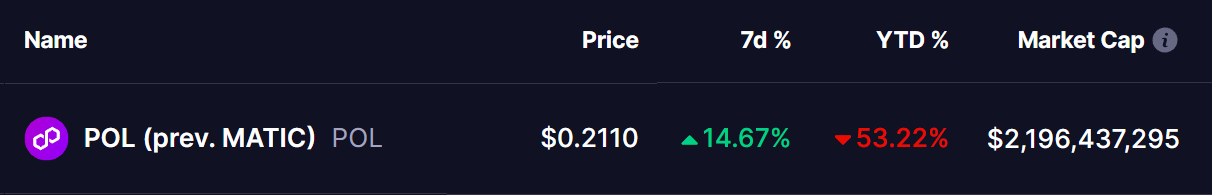
But there’s a shift in momentum brewing. POL has managed to stage a rebound with an impressive over 14% weekly gain, narrowing its year-to-date drop to 53%. And interestingly, a classic harmonic pattern now hints that this recovery could continue further.
Harmonic Pattern Signals More Upside Move
The daily chart for POL (based on Heikin Ashi candles) reveals the development of a Bearish Cypher pattern, a well-regarded formation in harmonic trading that typically precedes a bullish impulse move toward its completion point — before any potential reversal risk emerges.
The pattern starts at point X with a high near $0.3397, followed by a strong drop to A, a corrective bounce to B, and then a steep decline to point C — which bottomed around $0.1531 on April 7. While point C slightly exceeds the ideal Fibonacci range for a textbook Cypher, the overall geometry and Fibonacci alignments remain valid and compelling.
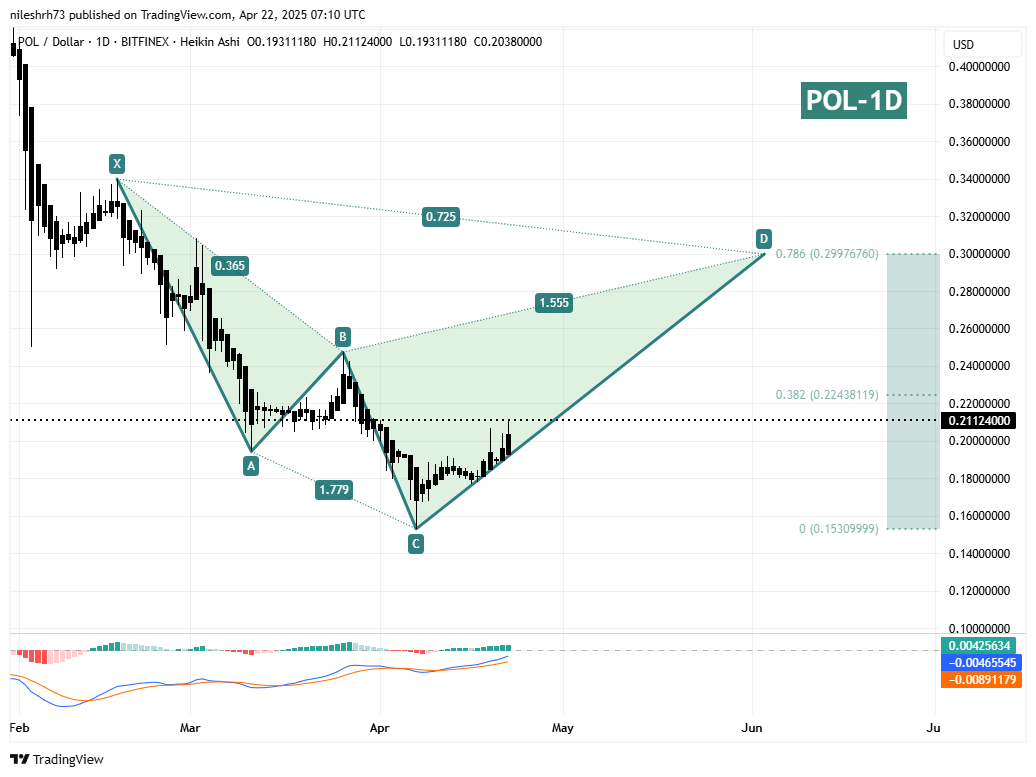
Currently, POL is building out the CD leg, which is the final stretch of this structure. The token has bounced confidently from its lows, and price action has been constructive over the past two weeks.
If the pattern completes as expected, the next major target sits at point D, which aligns with the 78.6% Fibonacci retracement level of the XC move — near $0.2997. That suggests a potential upside of around 41% from current levels near $0.21.
What’s Next for POL?
A move toward $0.2997 would not only fulfill the Cypher harmonic structure but also bring POL into a key resistance zone — one that could invite profit-taking or even spark a reversal. This level is significant from both a pattern-completion and a technical perspective.
Before that, however, bulls must clear intermediate resistance around $0.2243 — the 38.2% Fibonacci level. A decisive break above this zone could add fuel to the rally, potentially accelerating the CD leg’s move toward the final target.

On the flip side, failure to break above $0.2243 or a sudden market-wide correction could invalidate the bullish scenario. Traders and investors should watch volume closely and consider momentum indicators (like MACD, which is currently flattening out) for confirmation.
Disclaimer: This article is for informational purposes only and not financial advice. Always conduct your own research before investing in cryptocurrencies.

The opinions and market insights shared on CoinsProbe represent the views of individual authors based on prevailing market conditions at the time of publication. Cryptocurrency investments carry significant risk and volatility. Readers are encouraged to conduct their own research and seek professional financial advice before making investment decisions. CoinsProbe and its contributors do not accept responsibility for financial losses or decisions made based on published content.
CoinsProbe may publish sponsored articles, affiliate links, or promotional collaborations. All sponsored material is clearly labeled to maintain transparency with our audience. Our editorial decisions remain fully independent, and advertising partnerships do not influence reviews, rankings, or published opinions.
Since 2023, CoinsProbe has delivered reliable insights on cryptocurrency, blockchain, and digital assets. Our content is created by experienced researchers and analysts who follow strict editorial standards focused on accuracy, transparency, and credibility. Every article is carefully reviewed and verified using trusted sources and current market data. We provide unbiased analysis and timely updates covering everything from emerging crypto projects to major industry developments.