Date: Sun, April 20, 2025 | 11:10 AM GMT
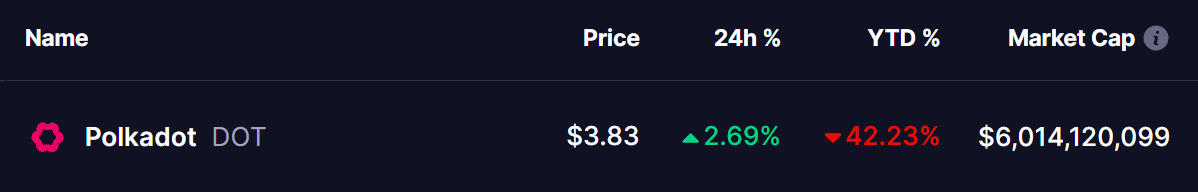
The cryptocurrency market has been under intense selling pressure recently, with Ethereum (ETH) posting its worst Q1 since 2018, sliding more than 45%. That bearish wave swept across the major altcoins— and the Polkadot (DOT) token wasn’t spared either as it declined by 42% this year.
But there’s a shift in momentum brewing as a classic harmonic pattern now hints that a rebound could rise further.
Harmonic Pattern Signals More Upside Move
The daily chart for DOT reveals the formation of a Bearish Gartley Pattern, but as of now, there’s still plenty of upside room left as the token approaches point D to complete the structure.
DOT’s sharp decline began around February 14, after it failed to hold above the $5.37 resistance level (marked as point X). Since then, the token lost nearly 40% of its value, eventually bottoming out near $3.25 on April 7 (point C).
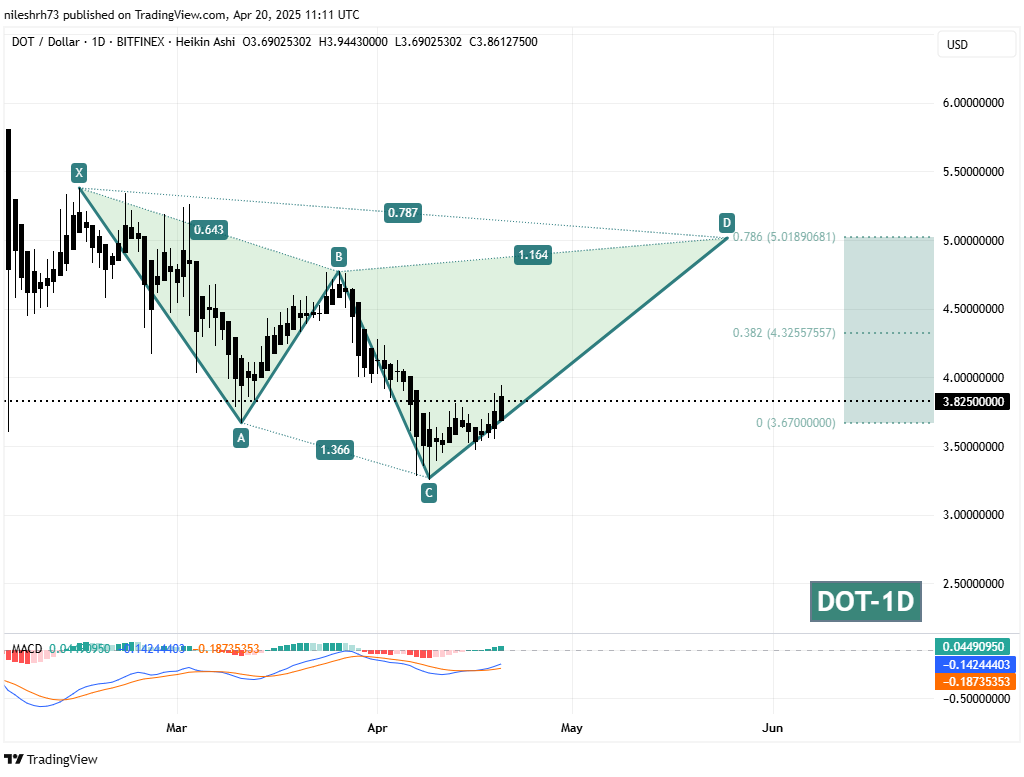
However, since hitting that low, DOT has shifted gears, and the recent price action suggests it is now completing the CD leg of the pattern — potentially setting the stage for a continuation of this uptrend.
From here, DOT could extend this rebound toward the final target (point D) of the Gartley pattern, projected at $5.01 — a potential gain of around 30% from the current price near $3.82 if the pattern plays out fully.
What’s Ahead?
Should this bullish momentum continue, traders and investors could watch for a move toward the $5.01 area. This zone represents not just the pattern completion but also coincides with the 78.6% Fibonacci retracement of the X-A leg, a major resistance area where a pullback could occur.
However, caution is still needed as DOT approaches the D point. Bearish reactions typically happen once harmonic patterns complete, meaning profit-taking and volatility could kick in once prices reach the upper target.
For now, the path appears tilted upward, with the $4.32 level (the 38.2% Fib retracement) acting as near-term resistance. A clear break above this zone could further strengthen the bullish setup and push DOT toward its pattern completion target.
Disclaimer: This article is for informational purposes only and not financial advice. Always conduct your own research before investing in cryptocurrencies.

The opinions and market insights shared on CoinsProbe represent the views of individual authors based on prevailing market conditions at the time of publication. Cryptocurrency investments carry significant risk and volatility. Readers are encouraged to conduct their own research and seek professional financial advice before making investment decisions. CoinsProbe and its contributors do not accept responsibility for financial losses or decisions made based on published content.
CoinsProbe may publish sponsored articles, affiliate links, or promotional collaborations. All sponsored material is clearly labeled to maintain transparency with our audience. Our editorial decisions remain fully independent, and advertising partnerships do not influence reviews, rankings, or published opinions.
Since 2023, CoinsProbe has delivered reliable insights on cryptocurrency, blockchain, and digital assets. Our content is created by experienced researchers and analysts who follow strict editorial standards focused on accuracy, transparency, and credibility. Every article is carefully reviewed and verified using trusted sources and current market data. We provide unbiased analysis and timely updates covering everything from emerging crypto projects to major industry developments.