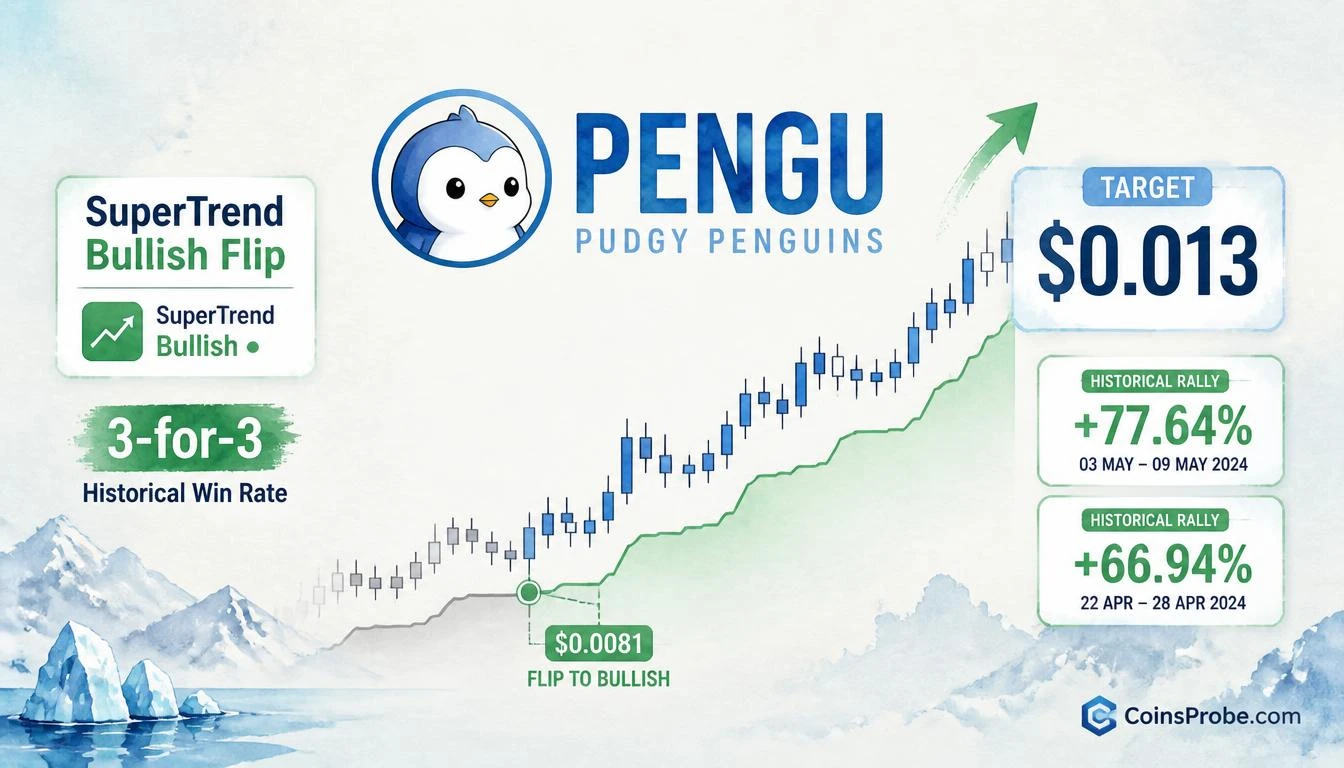

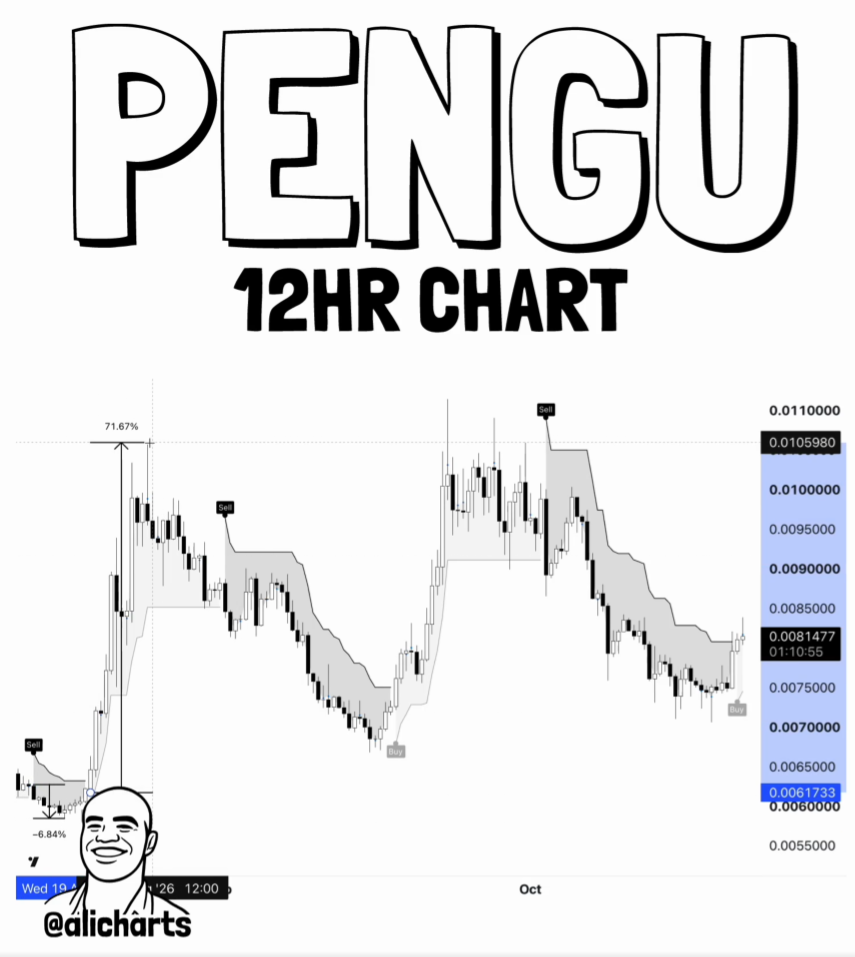
- PENGU SuperTrend flips bullish above $0.0081 — signal that has preceded every prior rally on this asset per @alicharts
- Prior TD Sequential buys produced +77.64% (Aug 7) and +66.94% (Sep 15) rallies; sell signal produced −31.58% correction
- TD Sequential and SuperTrend fired simultaneously — strongest confluence in PENGU's documented signal history
- Martinez projects $0.013 target (~60% from $0.0081) based on average of two prior completed sequences
Pudgy Penguins (PENGU) is flashing another buy signal — and the indicator generating it has yet to be wrong on this asset. Analyst Ali Martinez (@alicharts) flagged on October 21, 2026, that the SuperTrend indicator has flipped bullish as PENGU pushes above $0.0081, marking what he identifies as the start of a new leg higher.
The signal carries weight not because of its name, but because of its documented track record on PENGU specifically. Every prior bullish flip of the SuperTrend on this asset preceded a measurable rally. Every bearish flip preceded a steep correction. That is a clean, verified pattern — and it has just triggered again.
Signal 1 — SuperTrend Bullish Flip Above $0.0081
The SuperTrend indicator calculates dynamic support and resistance bands using Average True Range (ATR) and a multiplier. When price closes above the upper band, the indicator flips bullish — signaling that momentum has shifted from sellers to buyers. It is a trend-following tool, not a mean-reversion one, which means it performs best when an asset is beginning a sustained directional move rather than oscillating.
For PENGU, the SuperTrend has operated as a near-perfect regime filter. According to Martinez’s analysis, every bearish flip was followed by a steep correction, and every bullish flip marked the beginning of a new rally phase. The current flip occurred as price broke above $0.0081 — a level Martinez identifies as the key breakout threshold for this signal to be valid.
Signal 2 — TD Sequential Daily Buy Signal (October 19, 2026)
Two days before the SuperTrend call, Martinez flagged a separate but reinforcing signal: the TD Sequential printed a new daily buy signal on PENGU. The TD Sequential counts nine consecutive closes in one direction — identifying momentum exhaustion rather than a price level. A completed nine-count on the bearish side signals that selling pressure has run its course and a reversal is statistically overdue.
With the structure of higher highs and higher lows intact on the daily chart, Martinez projected that if the ~70% average rally from prior TD Sequential buy signals repeats, PENGU targets $0.013. That projection is derived from the prior two completed sequences — not from a cycle average or arbitrary extension.
The Verified Track Record — Three Signals, Three Outcomes
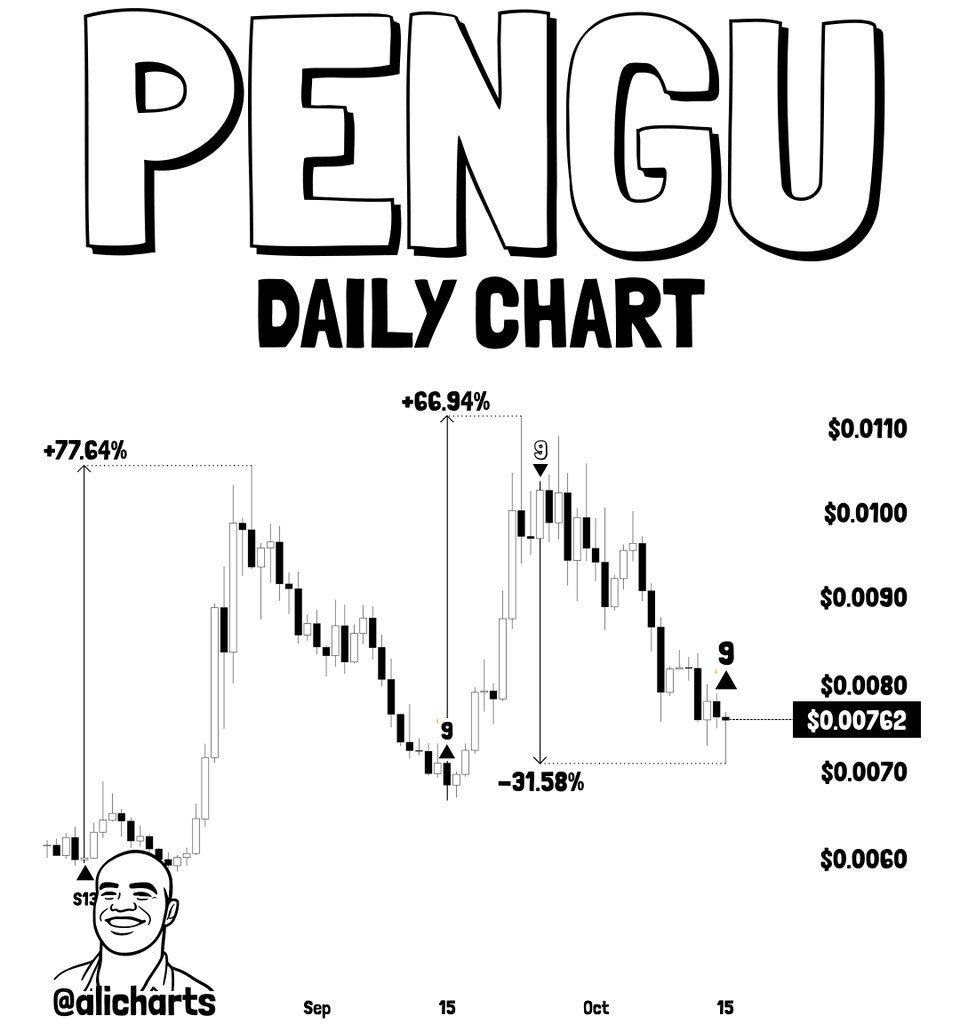
This is not a case of pattern-fitting after the fact. The prior PENGU signals from Martinez carry documented, exact returns:
| Signal Date | Signal Type | Outcome |
|---|---|---|
| August 7, 2026 | TD Sequential Buy | +77.64% |
| September 15, 2026 | TD Sequential Buy | +66.94% |
| September 25, 2026 | TD Sequential Sell | −31.58% |
Source: @alicharts (X), October 19–21, 2026
Two buys, two rallies averaging +72.29%. One sell, one correction of −31.58%. The sell signal’s accuracy is equally important — it validates the system bidirectionally, not just on the upside. A tool that is only right when bullish is useless. This one has been right in both directions on PENGU.
The current setup now aligns both the SuperTrend bullish flip and a TD Sequential buy signal simultaneously — a double confirmation that has not appeared together in the documented history above. If anything, the concurrent firing of two independent momentum signals makes the current setup structurally stronger than either of the prior individual buy signals.
The Fundamental Layer — SoFi Listing and 15M+ Member Base
Martinez also referenced PENGU’s structural fundamentals as a supporting factor. The token received a SoFi exchange listing alongside an existing community of over 15 million members in the Pudgy Penguins ecosystem. These are not price drivers on their own — exchange listings expand liquidity and accessibility, and large community bases provide retail distribution depth. But they function as demand-side infrastructure that can amplify a technically-triggered move once momentum initiates.
It is worth contextualizing this within the broader market environment. Traders tracking macro conditions can review whether Bitcoin’s equity correlation is returning — since NFT-adjacent tokens like PENGU tend to amplify Bitcoin’s directional moves, particularly to the upside.
The Target and the Invalidation
Martinez’s stated target, derived from averaging the two prior TD Sequential rallies, is $0.013. That represents approximately a 60% move from the $0.0081 breakout level. It is not a measured move from a chart pattern — it is an empirical projection from the two prior completed sequences on this specific asset.
The invalidation is implicit in the structure: a loss of the $0.0081 level on a closing basis would negate the SuperTrend bullish flip, reverting the indicator to neutral or bearish. That level is both the trigger and the line. Below it, the signal did not confirm. Above it, the two-signal confirmation is live.
Bullish Scenario — Hold Above $0.0081
PENGU sustains above $0.0081, SuperTrend remains in bullish regime. If the +70% average from prior TD Sequential buys (Aug 7: +77.64%, Sep 15: +66.94%) repeats, target is $0.013. Double confirmation from two independent signals makes this the strongest setup in PENGU’s documented signal history.
Bearish Scenario — Loss of $0.0081
A daily close below $0.0081 invalidates the SuperTrend bullish flip. The September 25 sell signal demonstrated what follows a failed bullish attempt: PENGU declined −31.58%. A breakdown here would reassert bearish regime control and negate both the SuperTrend and TD Sequential confluence.
For traders monitoring the NFT token space alongside broader altcoin activity, Hyperliquid’s $1.75M HYPE burn in 24 hours underscores the kind of protocol-level activity currently driving risk appetite across the market.
Two independent signals — SuperTrend bullish flip and TD Sequential buy — have fired simultaneously on PENGU above $0.0081. The prior two TD Sequential buys produced rallies of +77.64% and +66.94%. The prior sell signal produced a −31.58% correction. The track record is three-for-three across both directions. Whether the current signal becomes the fourth confirmed outcome will be determined at $0.0081 as the critical hold level and $0.013 as the stated target in sessions ahead. Watch $0.0081 — a close below it ends the bull case entirely.
Frequently Asked Questions
What is the SuperTrend indicator and why does it matter for PENGU?
What is the price target for PENGU based on the current buy signal?
What level would invalidate the PENGU buy signal?
Why are two signals firing at once more significant than one?
Source: Ali Charts · Published by CoinsProbe Markets Desk
The opinions and market insights shared on CoinsProbe represent the views of individual authors based on prevailing market conditions at the time of publication. Cryptocurrency investments carry significant risk and volatility. Readers are encouraged to conduct their own research and seek professional financial advice before making investment decisions. CoinsProbe and its contributors do not accept responsibility for financial losses or decisions made based on published content.
CoinsProbe may publish sponsored articles, affiliate links, or promotional collaborations. All sponsored material is clearly labeled to maintain transparency with our audience. Our editorial decisions remain fully independent, and advertising partnerships do not influence reviews, rankings, or published opinions.
Since 2023, CoinsProbe has delivered reliable insights on cryptocurrency, blockchain, and digital assets. Our content is created by experienced researchers and analysts who follow strict editorial standards focused on accuracy, transparency, and credibility. Every article is carefully reviewed and verified using trusted sources and current market data. We provide unbiased analysis and timely updates covering everything from emerging crypto projects to major industry developments.