
Key Takeaways
- Ondo (ONDO) has recorded an all-time high TVL of $2.52 billion, rising over 31% in the past 30 days, signaling strong on-chain growth.
- Active addresses, holders, and stablecoin market cap have all surged sharply, despite ONDO’s recent price correction.
- The daily chart shows a right-angled descending broadening wedge, a structure that often appears near potential trend reversals.
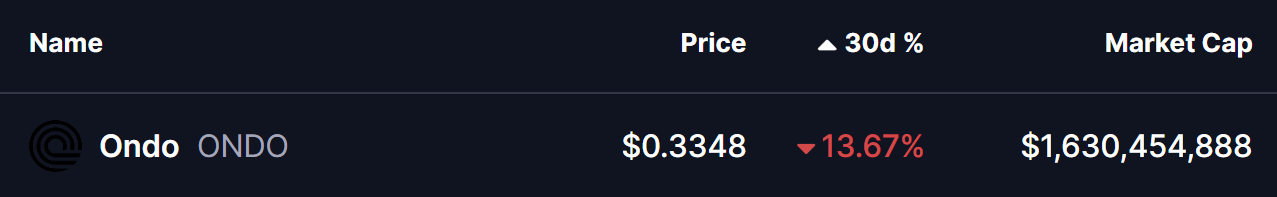
The real-world asset (RWA) token Ondo (ONDO) has faced notable pressure in recent weeks, sliding nearly 13% over the past month amid the broader crypto market correction. However, while price action has remained under stress, on-chain data and chart structure tell a very different story — one that hints at growing accumulation and a potential bullish rebound forming beneath the surface.
On-Chain Activity Surges Despite Price Weakness
According to the latest data from RWA.xyz, Ondo’s fundamentals continue to strengthen at an impressive pace. The protocol has now recorded an all-time high total value locked (TVL) of $2.52 billion, marking a 31.15% increase in just the past 30 days — a strong signal of rising institutional and on-chain demand.
Other key on-chain metrics are also trending higher:
- Stablecoin market cap: $74.28 million, up 118% month-over-month
- Total holders: 67,745, up 34.8% in 30 days
- Monthly active addresses: 83,519, surging more than 210%
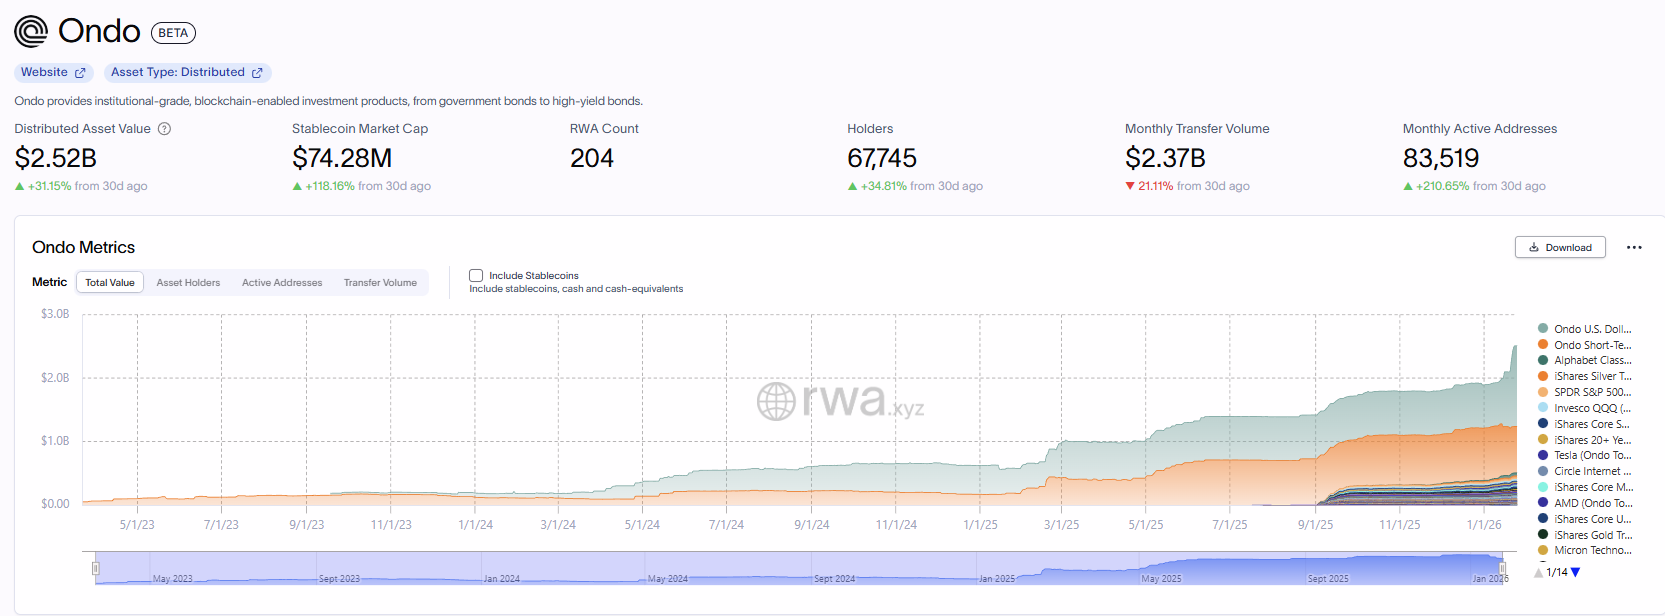
This sharp rise in participation and capital flow suggests that users and institutions are increasingly engaging with Ondo’s RWA ecosystem, even as the token’s price consolidates near cycle lows.
Is a Bullish Rebound Taking Shape?
From a technical perspective, ONDO’s daily chart is carving out a right-angled descending broadening wedge — a structure commonly seen during prolonged corrections that can precede trend reversals once selling pressure begins to fade.
This pattern has been developing since ONDO’s rejection from the $1.00–$1.17 resistance zone in September 2025. Since then, price has continued to form lower highs, while volatility has expanded, driving ONDO toward the lower boundary of the wedge near $0.32.
Encouragingly, that support zone has now been successfully defended. Buyers have stepped in near the lower trendline, with ONDO currently hovering around $0.335, suggesting that downside momentum may be weakening after weeks of sustained selling.
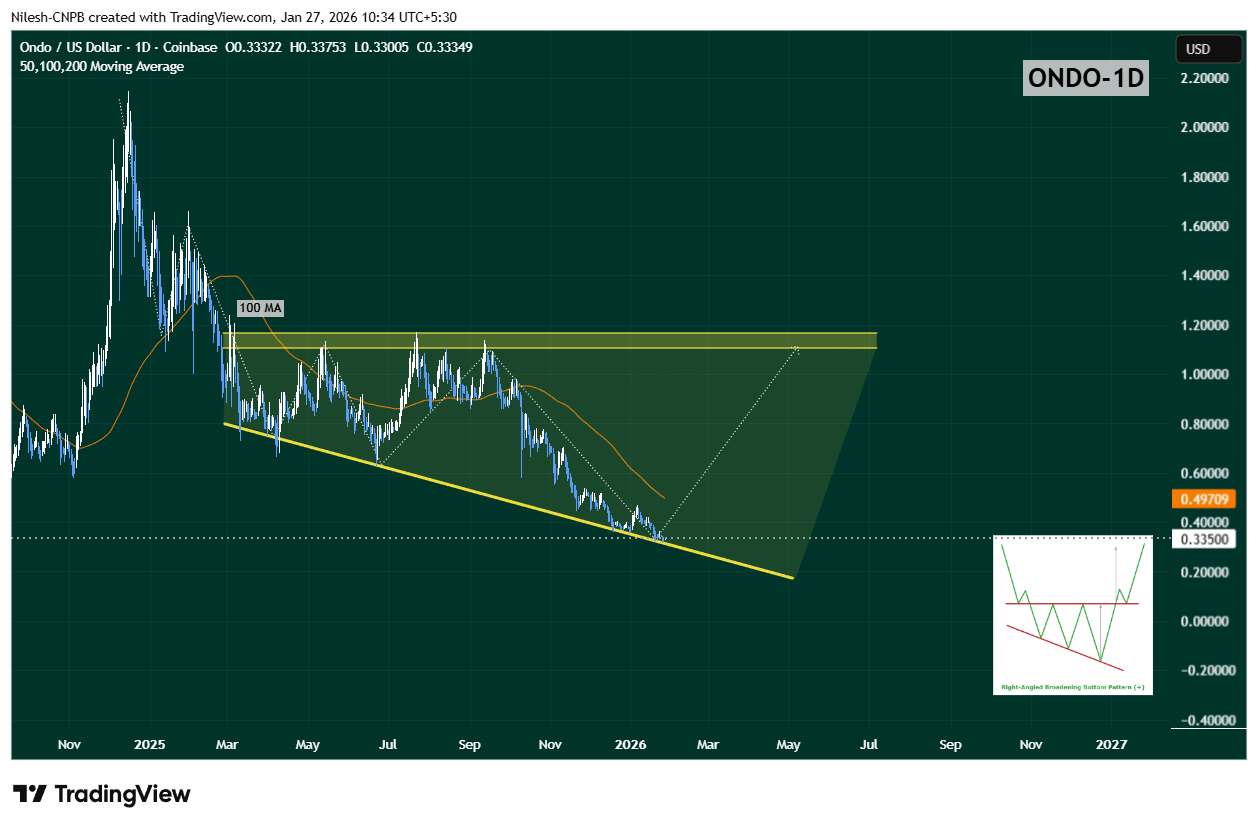
Despite early stabilization, upside momentum remains capped for now. The 100-day moving average, sitting near $0.4970, has flipped into strong overhead resistance. Every prior relief rally has stalled below this level, making it a key hurdle for bulls.
Until ONDO can reclaim this moving average, any upside move should be treated as a relief bounce within consolidation, rather than a confirmed trend reversal.
What’s Next for ONDO?
As long as ONDO continues to hold above the $0.32 support zone, the right-angled descending broadening wedge remains valid. Sustained defense of this level keeps the door open for a recovery attempt, especially if price begins posting higher daily or weekly closes.
A reclaim of the 50-day moving average, followed by a breakout above the 100-day MA, would mark a clear shift in momentum. If that scenario plays out, ONDO could gradually advance toward the upper boundary of the wedge, currently aligning near the $1.10–$1.17 region — a move that would represent a major recovery from current levels.
However, a decisive breakdown below the wedge support would invalidate the bullish setup and likely lead to another phase of downside or extended consolidation.
Bottom Line
While ONDO’s price remains under pressure, the disconnect between price action and on-chain growth is becoming increasingly difficult to ignore. Record-high TVL, surging active addresses, and expanding holder counts suggest strong accumulation is taking place beneath the surface.
Combined with a technically constructive wedge pattern near long-term support, ONDO may be approaching a pivotal inflection point — one where fundamentals and structure align for a potential bullish rebound, provided key support levels continue to hold.
Disclaimer: The views and analysis presented in this article are for informational purposes only and reflect the author’s perspective, not financial advice. Technical patterns and indicators discussed are subject to market volatility and may or may not yield the anticipated results. Investors are advised to exercise caution, conduct independent research, and make decisions aligned with their individual risk tolerance.
About Author: Nilesh Hembade is the Founder and Lead Author of Coinsprobe, with over 5 years of experience in the cryptocurrency and blockchain industry. Since launching Coinsprobe in 2023, he has been providing daily, research-driven insights through in-depth market analysis, on-chain data, and technical research.

The opinions and market insights shared on CoinsProbe represent the views of individual authors based on prevailing market conditions at the time of publication. Cryptocurrency investments carry significant risk and volatility. Readers are encouraged to conduct their own research and seek professional financial advice before making investment decisions. CoinsProbe and its contributors do not accept responsibility for financial losses or decisions made based on published content.
CoinsProbe may publish sponsored articles, affiliate links, or promotional collaborations. All sponsored material is clearly labeled to maintain transparency with our audience. Our editorial decisions remain fully independent, and advertising partnerships do not influence reviews, rankings, or published opinions.
Since 2023, CoinsProbe has delivered reliable insights on cryptocurrency, blockchain, and digital assets. Our content is created by experienced researchers and analysts who follow strict editorial standards focused on accuracy, transparency, and credibility. Every article is carefully reviewed and verified using trusted sources and current market data. We provide unbiased analysis and timely updates covering everything from emerging crypto projects to major industry developments.