Date: Mon, April 21, 2025 | 07:44 PM GMT
The cryptocurrency market has been under intense selling pressure recently, with Ethereum (ETH) posting its worst Q1 since 2018, sliding more than 45%. That bearish wave swept across the major altcoins — and the AI narrative token Near Protocol (NEAR) wasn’t spared either.
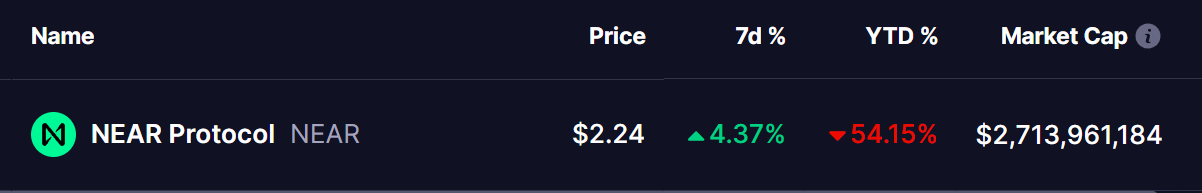
But there’s a shift in momentum brewing. NEAR has managed to stage a rebound with a noticeable 4% weekly gain, narrowing its year-to-date drop to 54%. And interestingly, a classic harmonic pattern now hints that this recovery could continue further.
Harmonic Pattern Signals More Upside Move
The 4-hour chart for NEAR reveals the formation of a Bearish Gartley pattern — a classic harmonic setup that usually predicts a strong bullish rally before facing significant resistance.
The sharp decline began around late March, after NEAR failed to sustain above the $3.09 resistance (marked as point X). From there, the altcoin slid nearly 41%, bottoming out near $1.83 on April 9 (point A).
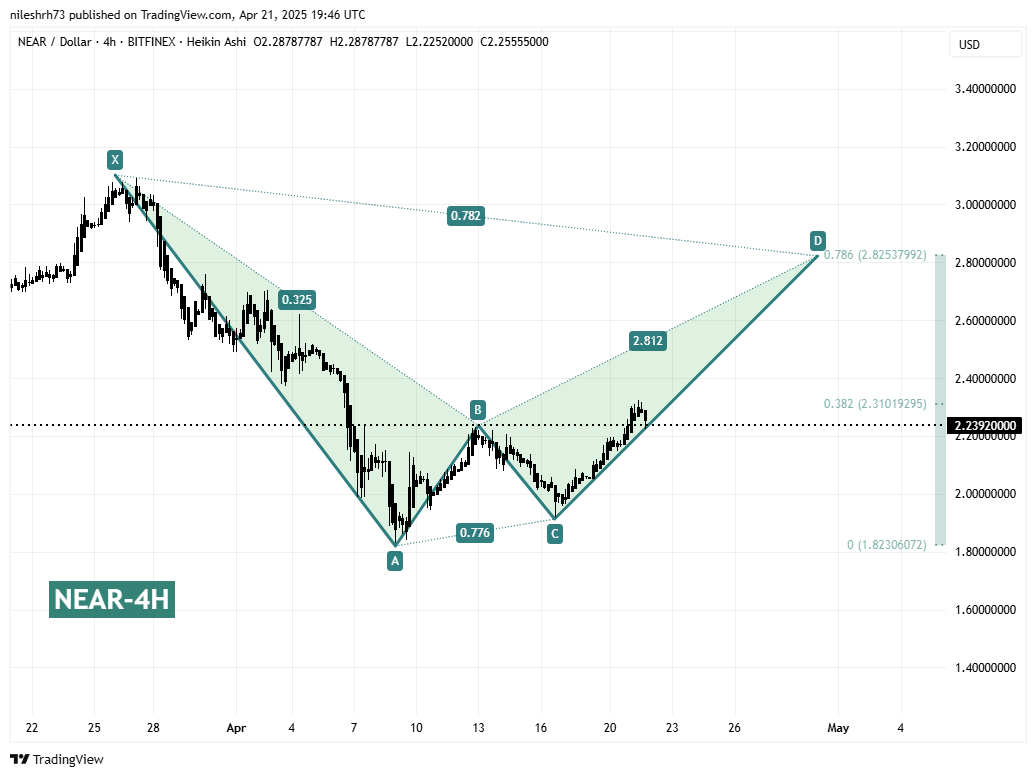
Following this low, NEAR posted a strong rebound from $1.92 (point C), carving out the CD leg of the pattern. At the time of writing, NEAR is trading near $2.24, still moving steadily upward within the structure.
According to the harmonic setup, NEAR has room to climb toward the pattern’s final target (point D) — located near $2.82 — implying about a 25% upside from current levels if the pattern plays out cleanly.
Importantly, this D-point also aligns with the 0.786 Fibonacci retracement of the major X-A move, adding more confluence to the potential resistance zone.

What’s Next for NEAR?
If buyers maintain momentum, NEAR could push toward the $2.82 level in the coming days, completing the Bearish Gartley structure. This zone would likely act as a strong resistance point, where traders may begin locking in profits or anticipating a corrective pullback.
On the downside, the $2.31 region (corresponding to the 38.2% Fibonacci retracement) is acting as an intermediate resistance. A clean break above this could accelerate the move toward $2.82.
However, traders should remain cautious. Harmonic patterns often result in sharp reversals after the D-point is hit — so while the short-term outlook appears bullish, it’s essential to watch for signs of exhaustion as NEAR approaches its target zone.
Disclaimer: This article is for informational purposes only and not financial advice. Always conduct your own research before investing in cryptocurrencies.

The opinions and market insights shared on CoinsProbe represent the views of individual authors based on prevailing market conditions at the time of publication. Cryptocurrency investments carry significant risk and volatility. Readers are encouraged to conduct their own research and seek professional financial advice before making investment decisions. CoinsProbe and its contributors do not accept responsibility for financial losses or decisions made based on published content.
CoinsProbe may publish sponsored articles, affiliate links, or promotional collaborations. All sponsored material is clearly labeled to maintain transparency with our audience. Our editorial decisions remain fully independent, and advertising partnerships do not influence reviews, rankings, or published opinions.
Since 2023, CoinsProbe has delivered reliable insights on cryptocurrency, blockchain, and digital assets. Our content is created by experienced researchers and analysts who follow strict editorial standards focused on accuracy, transparency, and credibility. Every article is carefully reviewed and verified using trusted sources and current market data. We provide unbiased analysis and timely updates covering everything from emerging crypto projects to major industry developments.