

Date: Mon, Jan 06, 2025, 09:59 AM GMT
The cryptocurrency market is showing strong momentum in altcoins, fueled by a decrease in Bitcoin (BTC) dominance from 58.12% on December 31 to 57.17% today. This environment has proven favorable for tokens like Mantra (OM), which is gaining traction with significant weekly gains and currently testing key resistance levels.

Bullish Pennant Formation
In November 2024, Mantra (OM) experienced an impressive bullish rally, pushing its price from a low of $1.28 to a high of $4.52. After this surge, the price consolidated within a bullish pennant pattern, forming a triangle structure as the market corrected. During this phase, OM visited the lower support level of $3.43 multiple times, providing a strong base for recovery.
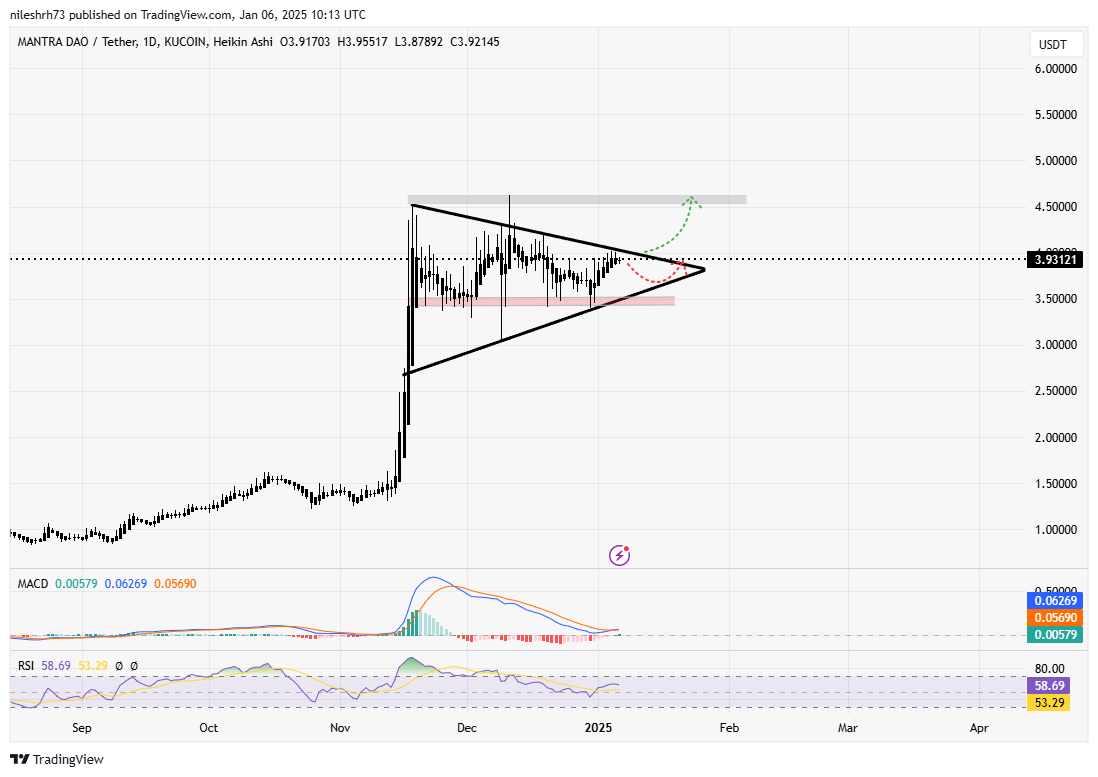
Following the broader market rebound, OM has climbed back to its current price of $3.93, approaching the upper resistance of the bullish pennant. If OM successfully breaks through this resistance, it could target the next significant resistance zone at $4.60—a potential 17% upside from its current price.
On the flip side, failure to break above the resistance may result in a pullback toward the $3.68 support zone within the pennant. A retest of support could give OM another chance to consolidate before making another breakout attempt.
Key Indicators
- MACD (Moving Average Convergence Divergence): The MACD is showing a mild bullish crossover, signaling potential upside momentum. However, the histogram suggests that buying pressure remains relatively moderate, and traders should watch for a surge in volume to confirm a breakout.
- RSI (Relative Strength Index): Currently sitting at 58.69, the RSI indicates that OM is in a neutral zone with room to climb further into bullish territory. A push above 60 could validate a breakout attempt.
What’s Next?
Mantra (OM) is at a critical juncture as it tests the apex of the bullish pennant pattern. Traders and investors should closely monitor the price action near the $3.93–$4.00 level for signs of a breakout. A decisive move above resistance, supported by increased trading volume, could propel OM toward the $4.60 target.
Conversely, a rejection at resistance would shift attention to the $3.68 support level. A breach below this support could invalidate the bullish pennant, leading to a more significant correction.
Disclaimer: This article is for informational purposes only and should not be considered financial advice. Always conduct your own research before making investment decisions.

The opinions and market insights shared on CoinsProbe represent the views of individual authors based on prevailing market conditions at the time of publication. Cryptocurrency investments carry significant risk and volatility. Readers are encouraged to conduct their own research and seek professional financial advice before making investment decisions. CoinsProbe and its contributors do not accept responsibility for financial losses or decisions made based on published content.
CoinsProbe may publish sponsored articles, affiliate links, or promotional collaborations. All sponsored material is clearly labeled to maintain transparency with our audience. Our editorial decisions remain fully independent, and advertising partnerships do not influence reviews, rankings, or published opinions.
Since 2023, CoinsProbe has delivered reliable insights on cryptocurrency, blockchain, and digital assets. Our content is created by experienced researchers and analysts who follow strict editorial standards focused on accuracy, transparency, and credibility. Every article is carefully reviewed and verified using trusted sources and current market data. We provide unbiased analysis and timely updates covering everything from emerging crypto projects to major industry developments.