Date: Mon, Nov 17, 2025 | 07:45 AM GMT
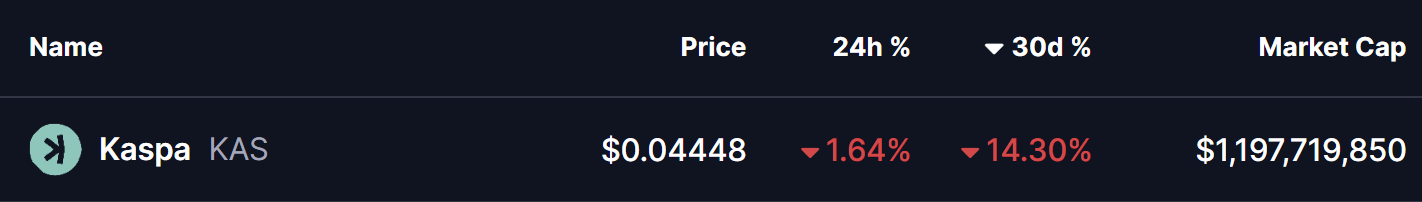
The broader altcoin market continues to face heavy volatility as Ethereum (ETH) has dropped more than 17% over the past 30 days, adding significant pressure on several major tokens, including Kaspa (KAS).
KAS has slipped nearly 14% during this period, but the chart is now hinting at something far more constructive beneath the recent weakness. A clearly defined harmonic structure is taking shape, suggesting that a potential rebound may be developing.
Harmonic Pattern Signals More Upside
On the 4-hour timeframe, Kaspa is forming a Bearish Gartley harmonic pattern—a setup that typically drives price higher until the final D-point completes. While the reversal generally occurs at the PRZ (Potential Reversal Zone), the approach toward that zone often brings steady upside movement.
The structure began at Point X near $0.060449, followed by a sharp decline into Point A. A bounce then carried price into Point B, before a deeper correction drove KAS into Point C around $0.042731. From this level, the token has started to climb again and is now trading near $0.044469, showing early signs of renewed momentum.
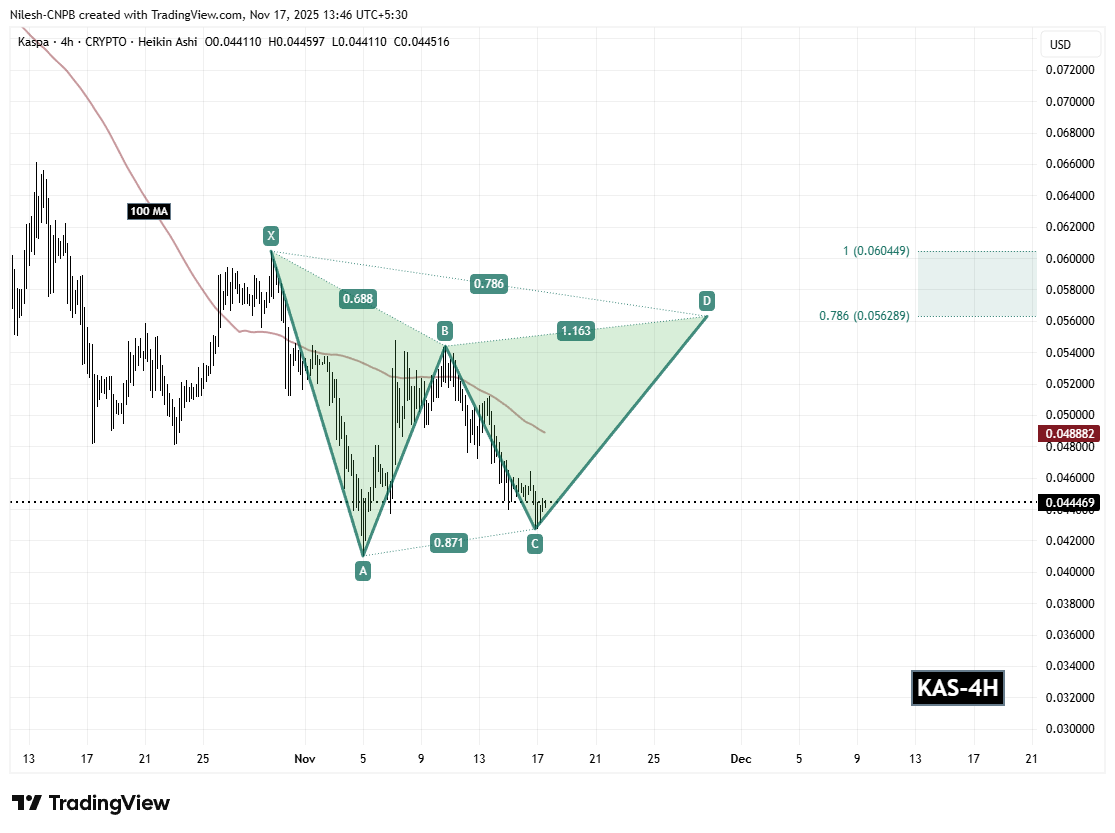
Adding strength to this setup is the 100-hour moving average, currently sitting around $0.048882. A reclaim of this level would indicate rising buyer conviction and serve as a strong confirmation of trend improvement.
What’s Next for KAS?
The immediate focus remains on the C-support region at $0.042731. Holding above this level is essential for keeping the harmonic structure intact. If KAS maintains this support and continues gaining momentum, the next major hurdle lies at the 100-hour moving average around $0.048882. A strong breakout above this dynamic resistance could open the door for the continuation of the CD-leg.
From there, KAS is likely to move toward the Potential Reversal Zone (PRZ) between the 0.786 Fibonacci extension at $0.056289 and the 1.0 extension at $0.060449. This is the region where the Gartley pattern is expected to complete before facing stronger resistance or a possible trend shift.
However, a failure to hold the C-support at $0.042731 would weaken the bullish outlook and could trigger deeper downside testing before any meaningful recovery resumes.
Disclaimer: The views and analysis presented in this article are for informational purposes only and reflect the author’s perspective, not financial advice. Technical patterns and indicators discussed are subject to market volatility and may or may not yield the anticipated results. Investors are advised to exercise caution, conduct independent research, and make decisions aligned with their individual risk tolerance.

The opinions and market insights shared on CoinsProbe represent the views of individual authors based on prevailing market conditions at the time of publication. Cryptocurrency investments carry significant risk and volatility. Readers are encouraged to conduct their own research and seek professional financial advice before making investment decisions. CoinsProbe and its contributors do not accept responsibility for financial losses or decisions made based on published content.
CoinsProbe may publish sponsored articles, affiliate links, or promotional collaborations. All sponsored material is clearly labeled to maintain transparency with our audience. Our editorial decisions remain fully independent, and advertising partnerships do not influence reviews, rankings, or published opinions.
Since 2023, CoinsProbe has delivered reliable insights on cryptocurrency, blockchain, and digital assets. Our content is created by experienced researchers and analysts who follow strict editorial standards focused on accuracy, transparency, and credibility. Every article is carefully reviewed and verified using trusted sources and current market data. We provide unbiased analysis and timely updates covering everything from emerging crypto projects to major industry developments.