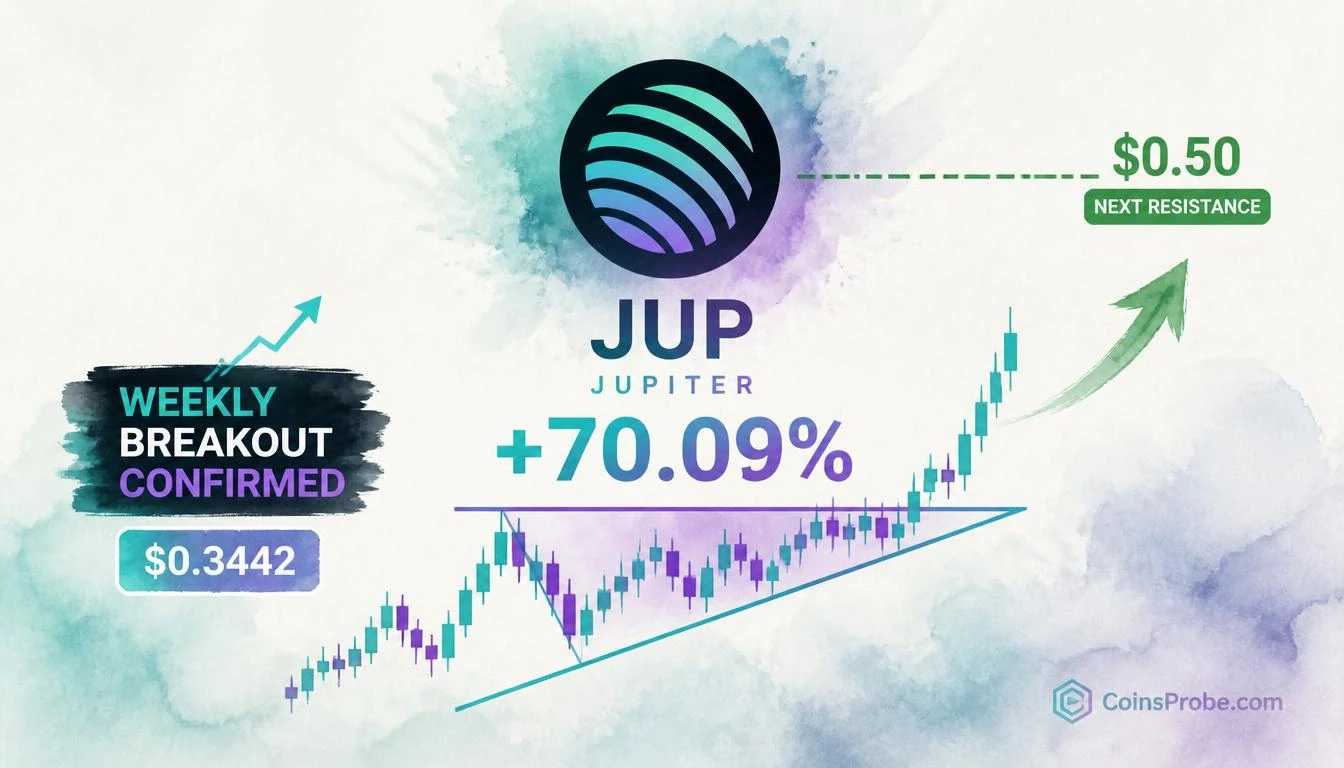

- JUP has delivered a 70.09% gain from its weekly ascending pattern breakout, per analyst @CryptoBullet1
- Current weekly close at $0.3442 with a high of $0.3709 and weekly decline of 5.47% — consolidation after breakout
- $0.50 is the next annotated resistance zone on the weekly chart; a close above would signal continuation
Jupiter (JUP) has delivered a 70.09% gain from the base of its weekly ascending pattern breakout — a move flagged in real time by analyst @CryptoBullet1, who noted the milestone with a single, precise annotation: “$JUP +70% so far.” At the time of writing, JUP is trading at approximately $0.3442 on the weekly chart, with the breakout already confirmed and partially realized.
The chart shared by @CryptoBullet1 on X presents JUP/USDT on the weekly timeframe via Binance — a timeframe that filters out noise and reveals the full architectural shape of the move. The 70.09% figure is not a forward projection. It is an already-achieved gain from the pattern’s breakout origin, printed directly on the chart to mark the distance covered. The question now is what the chart says about what comes next.
The Weekly Pattern — What the Chart Reveals
The weekly JUP/USDT chart shows a rising wedge or ascending triangle structure — two converging trendlines drawn across the swing lows — followed by a sharp upward breakout confirmed by directional arrows annotated by the analyst. This type of structure compresses price into a tighter range over successive weeks before releasing directional energy when one boundary is decisively breached.
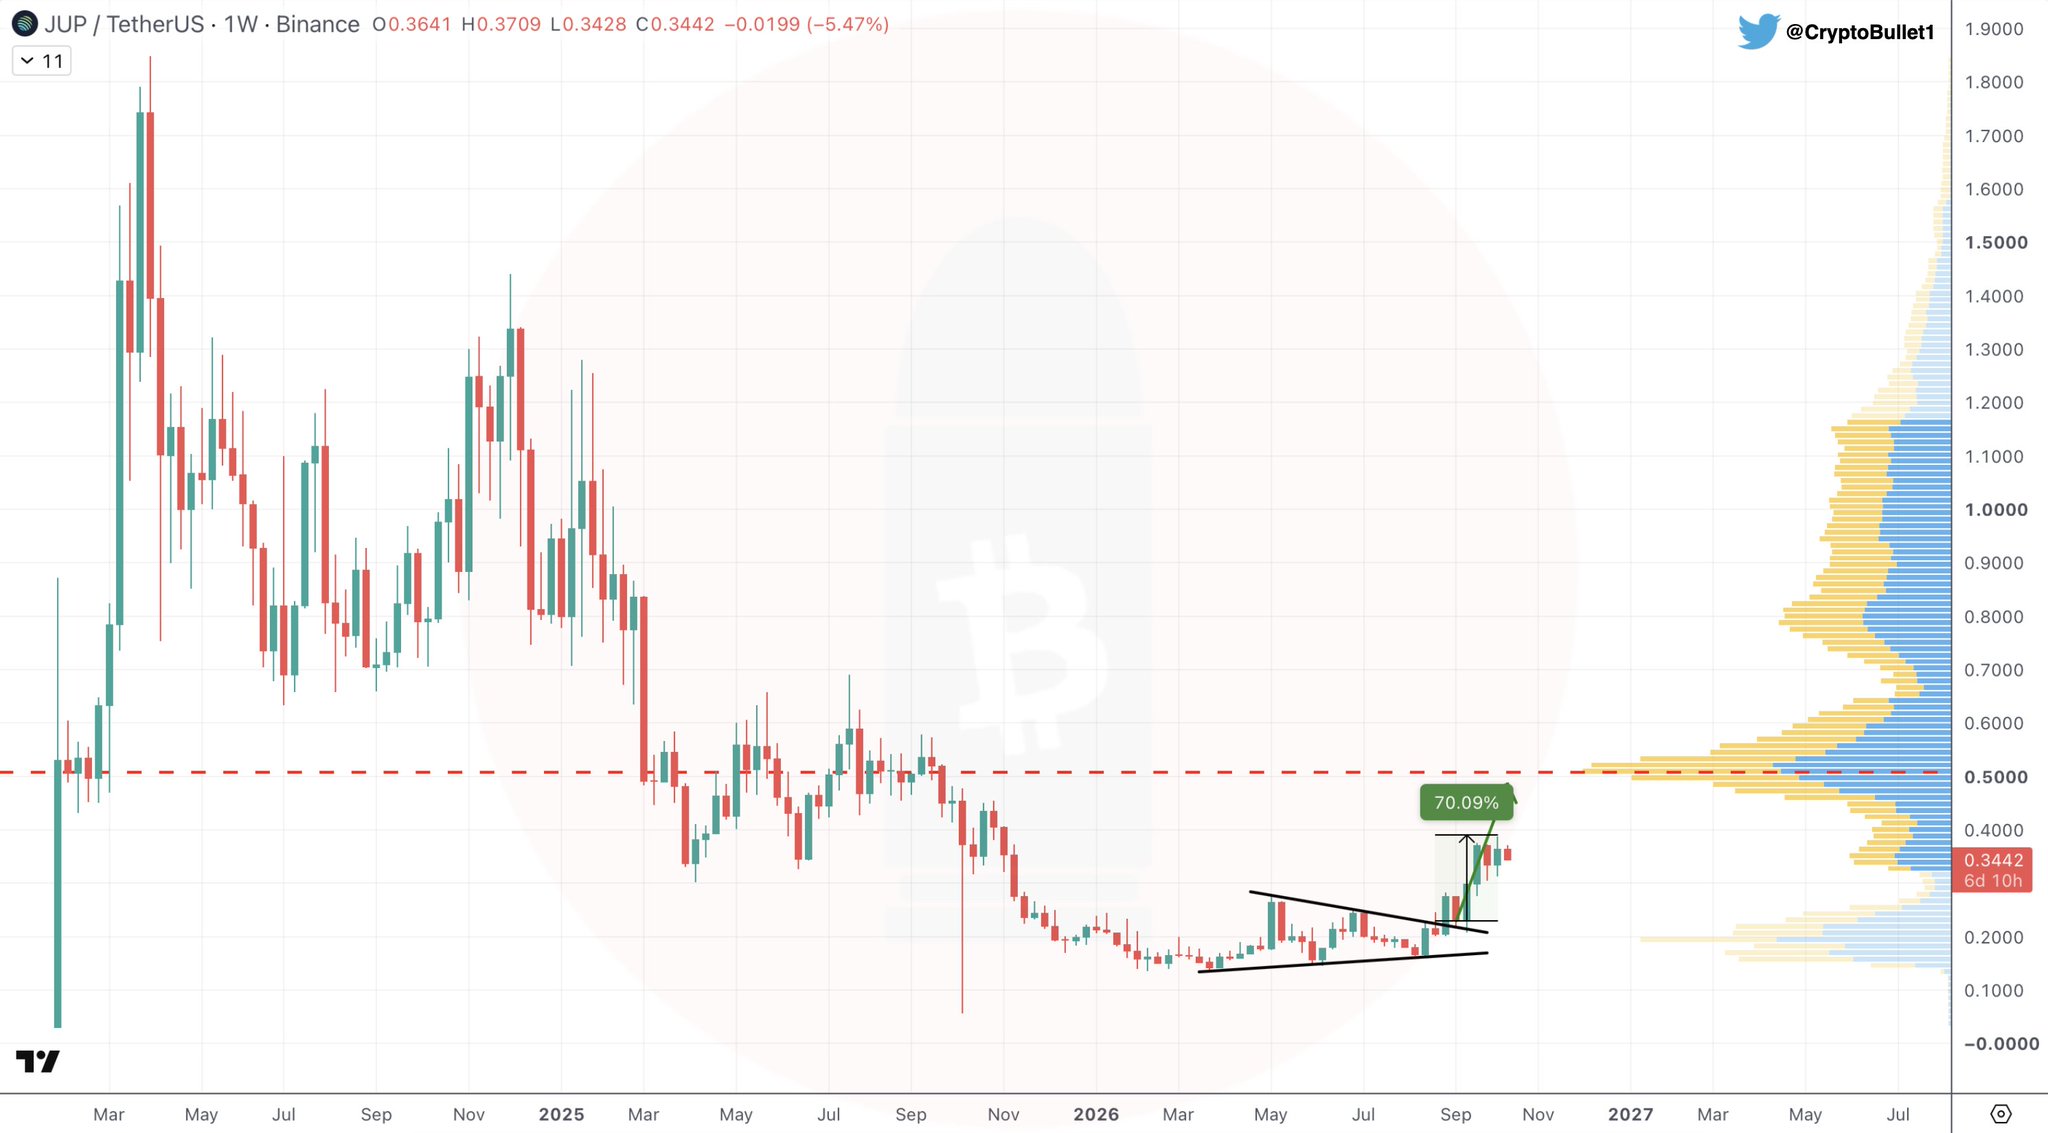
The breakout from this pattern has already produced the 70.09% advance that @CryptoBullet1 labels on the chart. The current weekly candle shows an open of $0.3641, a high of $0.3709, a low of $0.3428, and a close of $0.3442 — down 5.47% on the week, suggesting the breakout move is digesting gains rather than reversing. This kind of consolidation after a large percentage advance is structurally normal within continuation patterns.
The $0.50 Zone — Next Significant Level
The chart carries one clearly annotated forward reference: a red dashed horizontal line near the $0.50 area, marking a prior resistance zone. This level was not invented for this article — it appears explicitly on the analyst’s chart as the next notable zone above current price. At $0.3442, reaching $0.50 would represent an additional ~45% advance from the current weekly close.
The $0.50 region has historical significance for JUP: it acted as resistance during prior rally attempts visible on the weekly timeframe. Resistance that has been tested and rejected multiple times tends to carry weight when approached again, making it the level that defines whether the current breakout extends into a larger structural move or stalls for a deeper consolidation phase.
Jupiter’s Protocol Context
The price action does not exist in isolation. Jupiter is the dominant DEX aggregator on Solana — a protocol that crossed $280 billion in cumulative transaction volume, a milestone that established JUP’s structural relevance within the Solana DeFi ecosystem. Protocol-level volume at that scale provides fundamental grounding to a technical breakout, distinguishing JUP from tokens where chart patterns lack on-chain substance.
Bullish and Bearish Scenarios
Bullish Scenario
JUP holds the current consolidation above the breakout structure and resumes the advance toward $0.50. A weekly close above $0.50 — which the analyst’s chart identifies as the next significant resistance — would open the next leg of the move. The 70.09% already realized from the breakout origin suggests the move carries enough momentum to test that level if consolidation remains shallow.
Bearish Scenario
A sustained weekly close back below the breakout trendline — roughly in the $0.30–$0.32 range — would undermine the breakout thesis and suggest the 70.09% advance was the extent of the move rather than a first leg. The current weekly candle’s lower wick at $0.3428 is the immediate level to monitor; a breakdown below it with weekly follow-through would shift the near-term structure bearish.
The chart’s message is specific and quantified: 70.09% from the pattern base has already been delivered. The next annotated level is $0.50. Whether JUP closes a weekly candle above that zone determines whether the breakout extends into a full measured move or enters an extended consolidation. Watch $0.3428 as the near-term floor and $0.50 as the level that confirms continuation.
Source: x.comFrequently Asked Questions
What does the 70.09% figure on the JUP chart actually represent?
What is the next key level for JUP after the current breakout?
Is JUP’s current weekly pullback of 5.47% a concern for the breakout thesis?
Why does Jupiter’s $280 billion transaction volume milestone matter for this analysis?
Source: Cryptobullet1 · Published by CoinsProbe Markets Desk
The opinions and market insights shared on CoinsProbe represent the views of individual authors based on prevailing market conditions at the time of publication. Cryptocurrency investments carry significant risk and volatility. Readers are encouraged to conduct their own research and seek professional financial advice before making investment decisions. CoinsProbe and its contributors do not accept responsibility for financial losses or decisions made based on published content.
CoinsProbe may publish sponsored articles, affiliate links, or promotional collaborations. All sponsored material is clearly labeled to maintain transparency with our audience. Our editorial decisions remain fully independent, and advertising partnerships do not influence reviews, rankings, or published opinions.
Since 2023, CoinsProbe has delivered reliable insights on cryptocurrency, blockchain, and digital assets. Our content is created by experienced researchers and analysts who follow strict editorial standards focused on accuracy, transparency, and credibility. Every article is carefully reviewed and verified using trusted sources and current market data. We provide unbiased analysis and timely updates covering everything from emerging crypto projects to major industry developments.