Date: Mon, Oct 28, 2024, 07:25 AM GMT
The cryptocurrency market has kicked off the last week of October with renewed bullish momentum, as Bitcoin (BTC) rises 2.3% in the past 24 hours to reach the $68,500 level. Following this rally in BTC, many altcoins have also begun to show signs of recovery. JasmyCoin (JASMY), in particular, is turning green today, up by 3% after a prolonged downtrend that spanned the past week and month. This bounce from support could signal the start of a larger reversal.

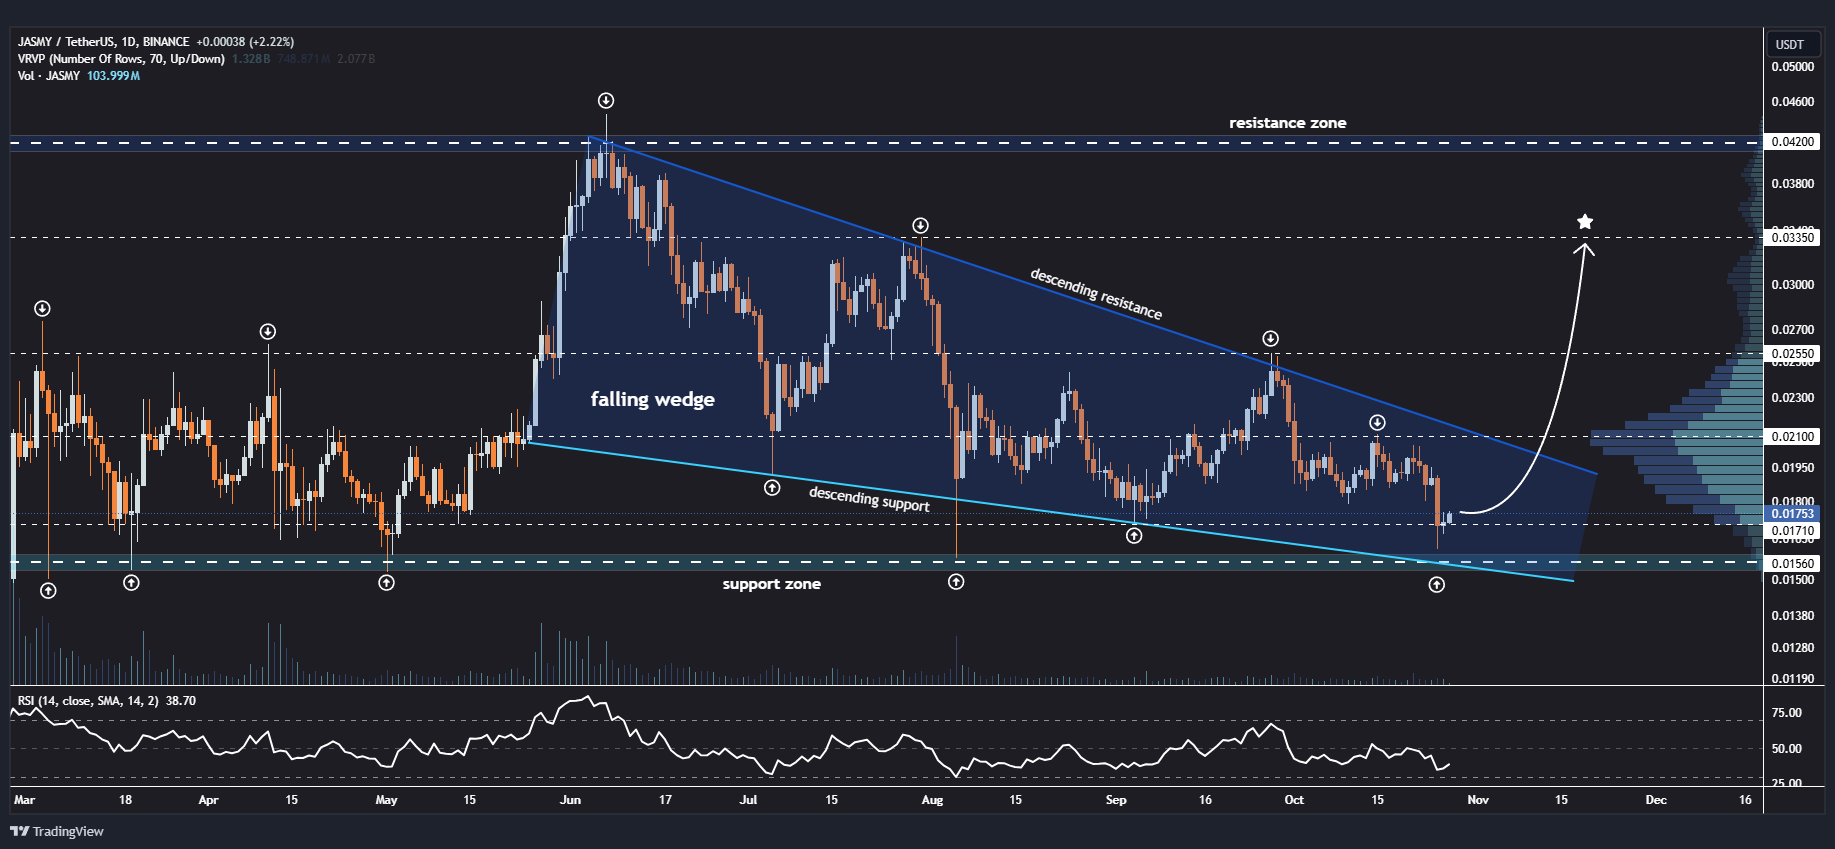
Notable analyst Jonathan Carter has shared an in-depth technical analysis of JASMY, highlighting key levels and patterns that suggest a potential upside in the near future. Here’s a closer look at the technical aspects driving JASMY’s recent price action and what could be next for the token.
Technical Analysis of JasmyCoin (JASMY)

- Falling Wedge Pattern
Since mid-July, JASMY has been trading within a falling wedge pattern, where the price has moved between converging descending support and resistance lines. This pattern is often a bullish indicator, suggesting that selling pressure is slowing down and a potential breakout could be on the horizon. If the price can break above the wedge’s descending resistance, it may confirm a reversal, paving the way for further gains. - Support Zone Strength
JASMY has consistently found strong support in the $0.01550–$0.01700 range. This zone has held multiple times in recent months, providing a solid foundation for buyers to step in. The recent bounce from this support suggests renewed interest from bulls, which could fuel a sustained rally if the momentum continues. - Key Resistance Levels to Watch
For a sustained bullish reversal, JASMY would need to clear multiple resistance levels. The first is around $0.02100, followed by $0.02550, with the final major target at $0.03350. A breakout above these levels would be a strong signal of bullish strength, potentially confirming an uptrend and attracting more buyers. - Volume and RSI
Volume has recently surged at the current support level, a positive sign indicating that there is buying interest at this price. Additionally, the RSI (Relative Strength Index) is currently near oversold territory at around 38.70. An oversold RSI typically signals that selling pressure may be exhausted, which could support the case for an upcoming rally if demand picks up.
Is It Time to Go for Upside?
With a strong support base, a bullish chart pattern, and favorable technical indicators, JASMY appears poised for a potential breakout. However, it’s crucial for traders to watch for confirmation of these signals by observing if the price can hold above key resistance levels.
If JASMY manages to break out from its falling wedge, traders may consider this a bullish opportunity, with the next major resistance at $0.03350. However, failure to break above the wedge’s resistance or a fall back below the support zone could indicate that bearish sentiment still prevails.
Disclaimer: This article is for informational purposes only and not financial advice. Always conduct your own research before investing in cryptocurrencies.


