
Date: Thu, Oct 23, 2025 | 03:10 PM GMT
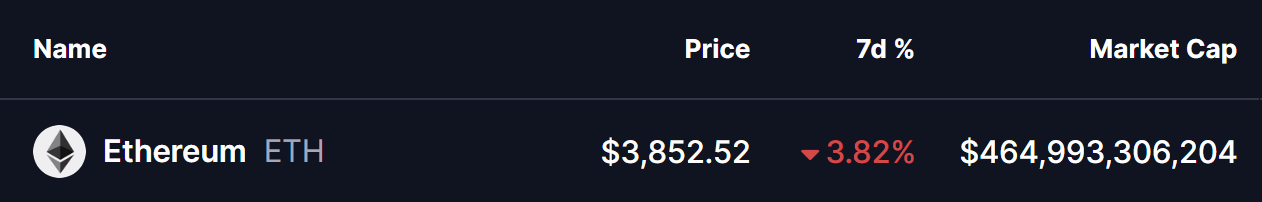
The broader cryptocurrency market remains in choppy momentum following the historic $19 billion liquidation event on October 10, which was triggered by escalating tariff tensions. The sell-off dragged Ethereum (ETH) from around $4,300 to a low of $3,404, before bouncing back to its current price near $3,850, still reflecting a 3.82% weekly decline.
However, beyond the red candles and cautious sentiment, Ethereum’s latest price action is beginning to mirror a familiar fractal pattern that previously appeared in Bitcoin (BTC) — and if history rhymes again, ETH could be gearing up for a major bullish continuation.
Fractal Setup Hints at a Bullish Continuation
According to crypto analyst CryptoBullet, Ethereum’s current structure is closely tracking Bitcoin’s February–December 2024 breakout fractal — a setup that preceded one of BTC’s strongest rallies after a prolonged corrective phase.
Back then, Bitcoin experienced a deep sell-off during the Yen Carry Trade crisis, but what followed was a remarkable 123% rally from its crash low as sentiment flipped bullish and momentum accelerated.
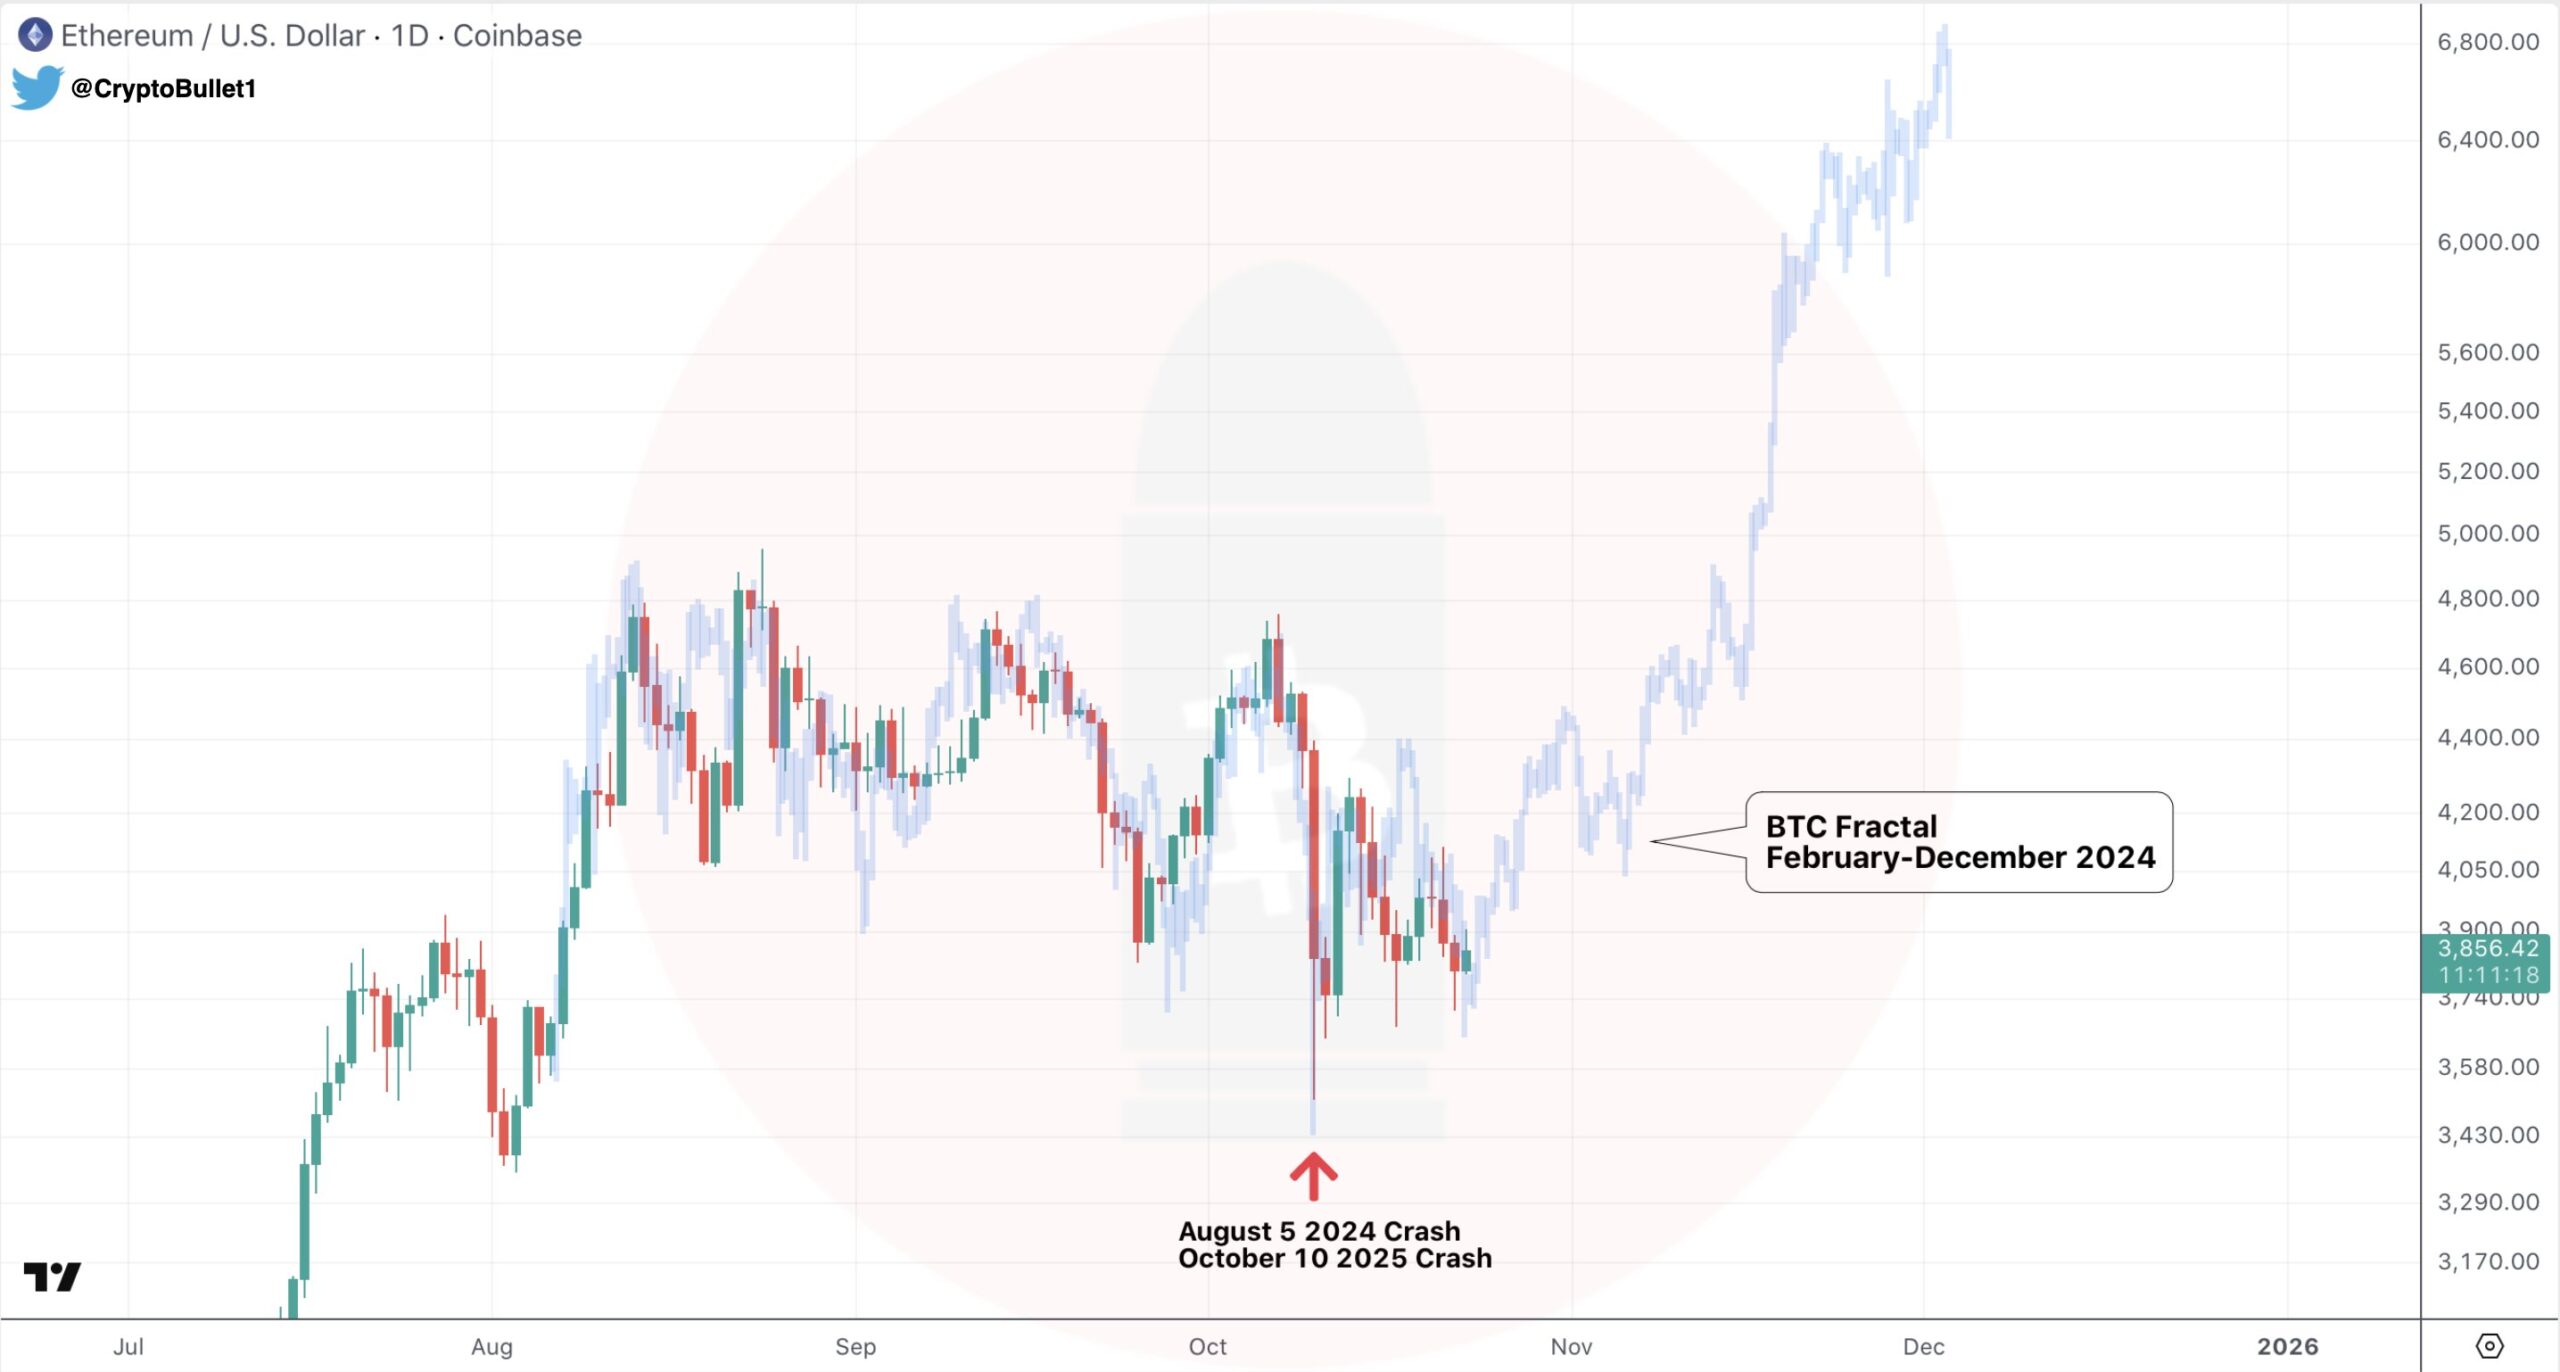
Now, Ethereum appears to be following a strikingly similar trajectory. The October 10 “tariff crash” pushed ETH down to around $3,400, forming a significant local bottom before buyers returned with confidence. Since then, ETH has recovered to $3,850, moving steadily toward its key resistance zone between $4,050 and $4,150 — the same structural region that marked Bitcoin’s confirmed reversal during its 2024 recovery phase.
What’s Next for ETH?
If this fractal pattern continues to play out, Ethereum could soon reclaim the $4,050–$4,150 resistance zone, confirming a breakout structure similar to BTC’s historical move. A decisive close above this level could pave the way for a powerful continuation rally, potentially lifting ETH toward the $6,800 region — a level that would mirror the BTC fractal projection overlayed on the current chart.
That said, fractal patterns are not guarantees — they serve as a visual map of repeating market behavior rather than a forecast.
For now, the pattern suggests Ethereum’s recovery momentum remains intact, with the next few days likely to determine whether ETH confirms its fractal-driven bullish breakout or pauses for a deeper retest.
Disclaimer: This article is for informational purposes only and not financial advice. Always conduct your own research before investing in cryptocurrencies.

The opinions and market insights shared on CoinsProbe represent the views of individual authors based on prevailing market conditions at the time of publication. Cryptocurrency investments carry significant risk and volatility. Readers are encouraged to conduct their own research and seek professional financial advice before making investment decisions. CoinsProbe and its contributors do not accept responsibility for financial losses or decisions made based on published content.
CoinsProbe may publish sponsored articles, affiliate links, or promotional collaborations. All sponsored material is clearly labeled to maintain transparency with our audience. Our editorial decisions remain fully independent, and advertising partnerships do not influence reviews, rankings, or published opinions.
Since 2023, CoinsProbe has delivered reliable insights on cryptocurrency, blockchain, and digital assets. Our content is created by experienced researchers and analysts who follow strict editorial standards focused on accuracy, transparency, and credibility. Every article is carefully reviewed and verified using trusted sources and current market data. We provide unbiased analysis and timely updates covering everything from emerging crypto projects to major industry developments.