Date: Tue, April 29, 2025 | 01:20 AM GMT
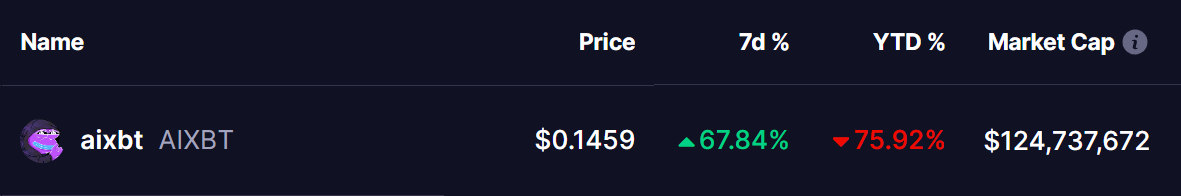
In the cryptocurrency market over the past three weeks, ETH has surged by 31%, and major tokens are finally showing signs of life after facing brutal corrections since the start of the year. One of the notable gainer has been the AI agent token, AIXBT, which just posted a sharp 67% weekly bounce, reducing its year-to-date losses to 75%.
But this isn’t just about price—it’s about the pattern. A fractal formation on the chart is sparking fresh excitement about AIXBT’s next move.
Fractal Breakdown: VIRTUAL vs. AIXBT
When comparing AIXBT with another AI-focused token, Virtual Protocol (VIRTUAL), the similarity is hard to ignore.
VIRTUAL’s price broke above its 50-day moving average (MA)—highlighted by a circled region—triggering a breakout through the first resistance zone (blue) and surging into the higher resistance band (green). The result? A massive 135% rally. It’s now consolidating just below $1.47.

Now look at AIXBT. On the right side of the chart, it shows a nearly identical setup. AIXBT recently broke above its 50-day MA, mimicking VIRTUAL’s early-stage breakout. It’s now trading around $0.149.
If this fractal plays out as expected, AIXBT could surge another 55% toward the $0.2317 resistance area (blue zone). A successful break above that would open the door to a potential run toward the green zone at $0.27 — an 80% gain from current levels.
The MACD indicator for AIXBT just turned bullish — a key signal of growing momentum. This same MACD behavior was observed on VIRTUAL’s chart right before its rally took off, reinforcing the case for a similar upside move in AIXBT.
What’s Next for AIXBT?
The next few daily closes are crucial. If AIXBT can hold above its 50-day MA and break into the resistance zone, traders may see a parabolic move play out—just like VIRTUAL.
Of course, this outlook assumes market conditions remain favorable. As always in crypto, things can change quickly. But for now, the charts are painting a clear picture: AIXBT is following a bullish fractal, and the upside potential is real.
That said, steep gains often come with steep corrections. Stay vigilant and manage risk carefully.
Disclaimer: This article is for informational purposes only and not financial advice. Always conduct your own research before investing in cryptocurrencies.

The opinions and market insights shared on CoinsProbe represent the views of individual authors based on prevailing market conditions at the time of publication. Cryptocurrency investments carry significant risk and volatility. Readers are encouraged to conduct their own research and seek professional financial advice before making investment decisions. CoinsProbe and its contributors do not accept responsibility for financial losses or decisions made based on published content.
CoinsProbe may publish sponsored articles, affiliate links, or promotional collaborations. All sponsored material is clearly labeled to maintain transparency with our audience. Our editorial decisions remain fully independent, and advertising partnerships do not influence reviews, rankings, or published opinions.
Since 2023, CoinsProbe has delivered reliable insights on cryptocurrency, blockchain, and digital assets. Our content is created by experienced researchers and analysts who follow strict editorial standards focused on accuracy, transparency, and credibility. Every article is carefully reviewed and verified using trusted sources and current market data. We provide unbiased analysis and timely updates covering everything from emerging crypto projects to major industry developments.