

Date: Sun, Dec 07, 2025 | 09:55 AM GMT
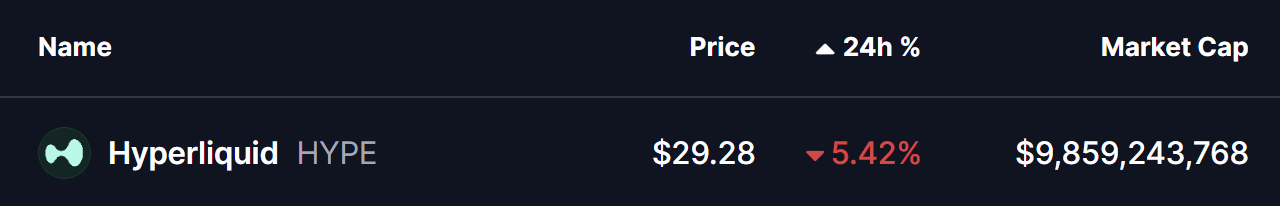
The broader crypto market begins the week on a cautionary note as mild downside in Bitcoin (BTC) and Ethereum (ETH) continues to pressure mid-cap performers. Hyperliquid (HYPE), which has already undergone a multi-week corrective phase, dipped another 5% today — but beneath this weakness lies a technical formation that could be setting the stage for a bullish reversal.
Triple Bottom in Play
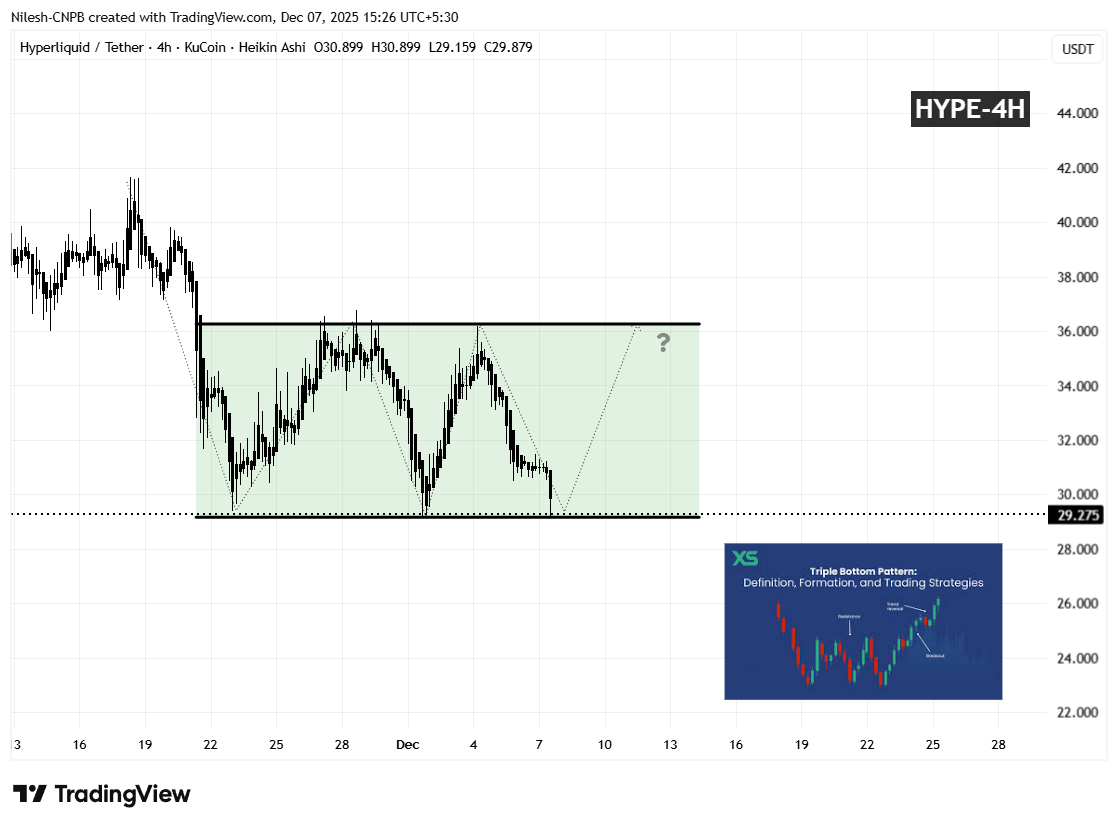
A clear Triple Bottom structure has emerged on the 4H timeframe — a classic reversal pattern characterized by three equal swing lows at a shared support base. Each dip toward the $29.15 support region has been met with notable buying pressure, suggesting demand absorption and exhaustion among sellers.
Across the highlighted consolidation zone, price continues to oscillate between the bottom floor at $29.15 and neckline resistance at $36.20, as seen repeatedly over the past two weeks. The latest retest once again brings HYPE to the same demand inflection point that previously triggered sharp upside moves.
This repeated defense is a strong sign of accumulation rather than continuation breakdown.
What’s Next for HYPE?
If buyers remain active at the $29.15 support and prevent any candle close below the range, HYPE could confirm its third structural low — completing the Triple Bottom formation and setting up a potential climb toward:
• Neckline resistance: $36.20
(upside potential of approx. +24% from current range)
A breakout above the neckline could further unlock a continuation leg toward the mid-$40 region, but that confirmation remains dependent on volume expansion and clean invalidation of the range ceiling.
However, if the price weakens and breaks and closes below $29.15, the bullish reversal scenario loses validity. Such a breakdown would convert the floor into resistance and may open the door toward deeper liquidity zones in the $26.50–$27.00 range.
For now, the market sits at a technical pressure point:
third test → rebound or rejection.
Disclaimer: The views and analysis presented in this article are for informational purposes only and reflect the author’s perspective, not financial advice. Technical patterns and indicators discussed are subject to market volatility and may or may not yield the anticipated results. Investors are advised to exercise caution, conduct independent research, and make decisions aligned with their individual risk tolerance.

The opinions and market insights shared on CoinsProbe represent the views of individual authors based on prevailing market conditions at the time of publication. Cryptocurrency investments carry significant risk and volatility. Readers are encouraged to conduct their own research and seek professional financial advice before making investment decisions. CoinsProbe and its contributors do not accept responsibility for financial losses or decisions made based on published content.
CoinsProbe may publish sponsored articles, affiliate links, or promotional collaborations. All sponsored material is clearly labeled to maintain transparency with our audience. Our editorial decisions remain fully independent, and advertising partnerships do not influence reviews, rankings, or published opinions.
Since 2023, CoinsProbe has delivered reliable insights on cryptocurrency, blockchain, and digital assets. Our content is created by experienced researchers and analysts who follow strict editorial standards focused on accuracy, transparency, and credibility. Every article is carefully reviewed and verified using trusted sources and current market data. We provide unbiased analysis and timely updates covering everything from emerging crypto projects to major industry developments.