
Key Takeaways
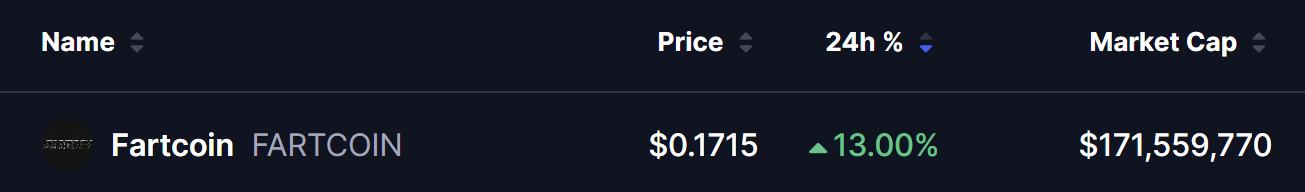
- FARTCOIN has surged around 13% amid a broader crypto market rebound led by Bitcoin and Ethereum.
- A Bearish Shark harmonic pattern is forming on the daily chart, signaling potential short-term upside continuation.
- The 50-day moving average at $0.2589 is the key resistance level to reclaim for bullish confirmation.
- Fibonacci extensions at $0.2982 and $0.3373 act as potential upside targets.
- The $0.13808 support zone remains critical to maintaining the bullish harmonic structure.
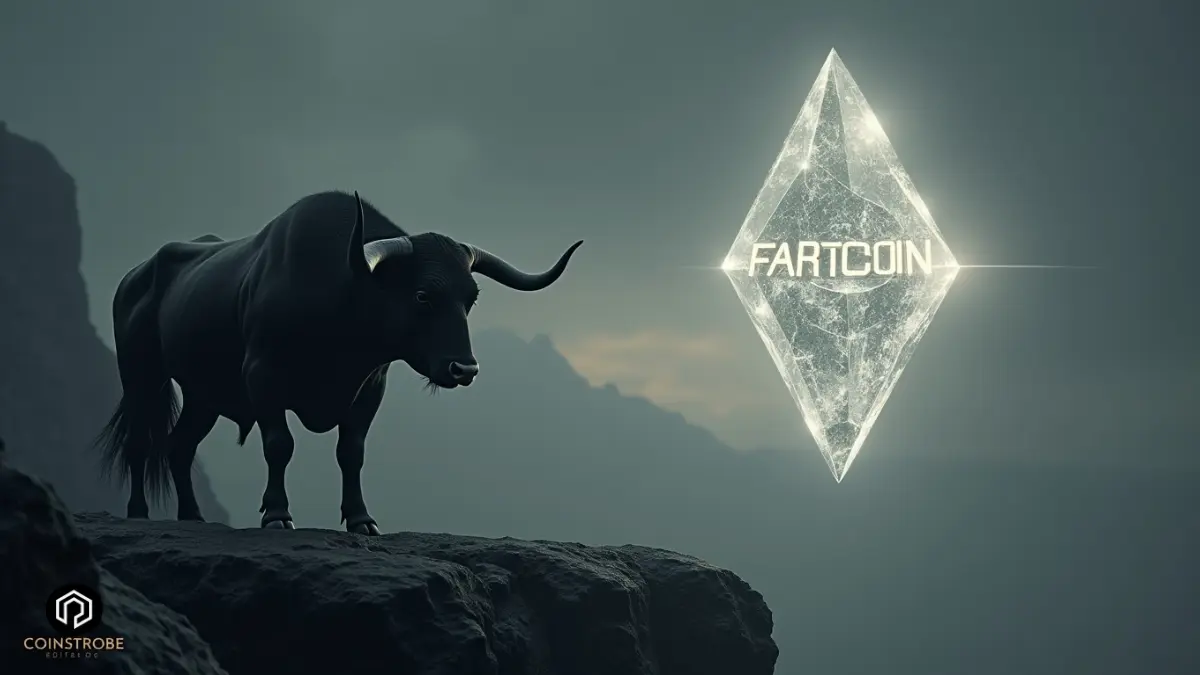
The broader cryptocurrency market is staging a strong rebound, with Bitcoin up 5% and Ethereum surging nearly 9% in the past 24 hours. This renewed wave of risk appetite is spilling over into the memecoin narrative, lifting Fartcoin (FARTCOIN) by 13%.
Beyond the daily bounce, FARTCOIN’s chart is now flashing a well-defined harmonic structure — a setup that often signals a continuation move toward a defined completion zone before any major reversal unfolds. In the current case, the structure suggests there could still be room for upside in the short term.
Technical Patterns Hint at Upside Momentum
From a technical perspective, FARTCOIN’s daily chart reveals the formation of a Bearish Shark harmonic pattern, a widely tracked structure in harmonic trading. Although the pattern is traditionally associated with a potential reversal once fully completed, price often extends higher toward the C-point before exhaustion sets in.
As seen on the chart, the O–X–A–B legs have already formed, with price finding solid support near the B-point around $0.13808. That level has acted as a reaction zone, where buyers stepped in to prevent further downside.
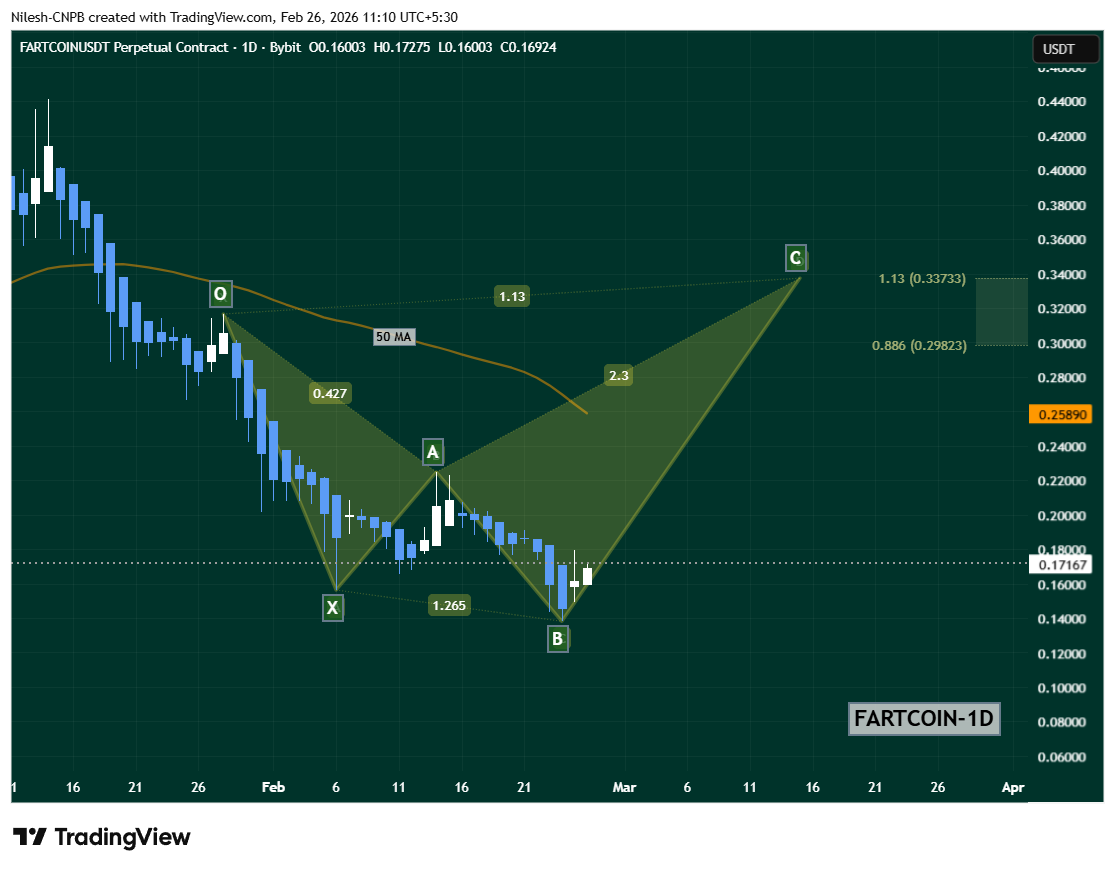
FARTCOIN is currently trading near $0.17, showing early signs of stabilization after the recent sell-off. The ability to hold above the B-point strengthens the case for a short-term continuation toward the projected harmonic completion levels.
The immediate hurdle for bulls remains the 50-day moving average, positioned near $0.2589. This level has acted as dynamic resistance in recent weeks, repeatedly capping upside attempts.
A clean and sustained reclaim of this moving average would mark a significant technical shift, potentially flipping it into a deciding support.
What’s Next for FARTCOIN?
A decisive daily close above the 50-day MA ($0.2589) would serve as strong confirmation that buyers are regaining control. Such a breakout could invite momentum traders back into the market, accelerating the recovery move.
If bullish momentum continues, the harmonic projections align closely with the following upside targets:
- 0.886 Fibonacci extension near $0.2982
- 1.13 Fibonacci extension near $0.3373
These levels represent potential completion zones for the Shark pattern, where traders may begin watching for signs of exhaustion or reversal.
However, bulls still have important levels to defend.
On the downside, the $0.13808 region remains the key structural support. As long as this zone holds, the harmonic framework stays intact and the upside scenario remains valid.
A sustained breakdown below $0.13808 would weaken the bullish outlook, invalidate the B-point support, and potentially push FARTCOIN into a deeper consolidation phase.
For now, the structure favors cautious optimism — but confirmation above the 50-day moving average will be the real test of strength.
Disclaimer: The views and analysis presented in this article are for informational purposes only and reflect the author’s perspective, not financial advice. Technical patterns and indicators discussed are subject to market volatility and may or may not yield the anticipated results. Investors are advised to exercise caution, conduct independent research, and make decisions aligned with their individual risk tolerance.
About Author: Nilesh Hembade is the Founder and Lead Author of Coinsprobe, with over 5 years of experience in the cryptocurrency and blockchain industry. Since launching Coinsprobe in 2023, he has been providing daily, research-driven insights through in-depth market analysis, on-chain data, and technical research.

The opinions and market insights shared on CoinsProbe represent the views of individual authors based on prevailing market conditions at the time of publication. Cryptocurrency investments carry significant risk and volatility. Readers are encouraged to conduct their own research and seek professional financial advice before making investment decisions. CoinsProbe and its contributors do not accept responsibility for financial losses or decisions made based on published content.
CoinsProbe may publish sponsored articles, affiliate links, or promotional collaborations. All sponsored material is clearly labeled to maintain transparency with our audience. Our editorial decisions remain fully independent, and advertising partnerships do not influence reviews, rankings, or published opinions.
Since 2023, CoinsProbe has delivered reliable insights on cryptocurrency, blockchain, and digital assets. Our content is created by experienced researchers and analysts who follow strict editorial standards focused on accuracy, transparency, and credibility. Every article is carefully reviewed and verified using trusted sources and current market data. We provide unbiased analysis and timely updates covering everything from emerging crypto projects to major industry developments.