Date: Mon, Nov 17, 2025 | 10:00 AM GMT
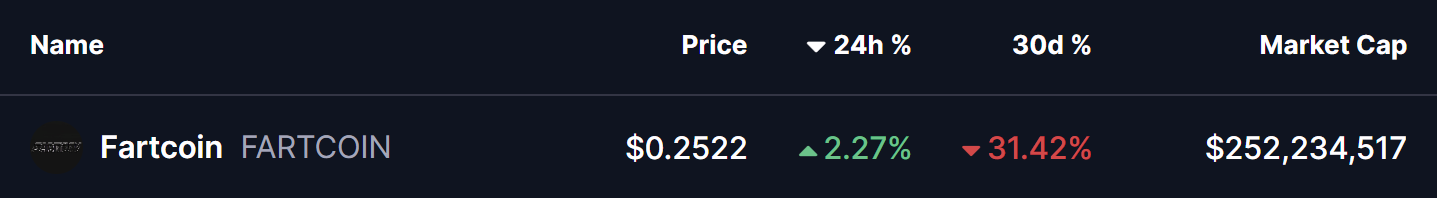
The broader market continues to show downside volatility as Ethereum (ETH) has declined more than 17% over the past 30 days, adding significant pressure on several major memecoins, including Fartcoin (FARTCOIN).
FARTCOIN has recorded a steep 31% dip during this period, but something far more important is developing beneath the surface. Its latest technical structure is beginning to show signs of a potential bullish recovery.
Double Bottom Pattern in Play?
On the daily chart, FARTCOIN appears to be forming a classic double-bottom pattern after a sharp downtrend that began when the token failed to break the $0.3475 neckline resistance in early November. From that point, the price entered a heavy correction phase, dropping more than 30% and revisiting the $0.24 support zone — the region now acting as the second bottom of the pattern.
The chart shows FARTCOIN respecting this support with multiple touches before bouncing back to $0.2521. This suggests early signs of a potential shift in momentum as buyers begin stepping in near the critical demand region.
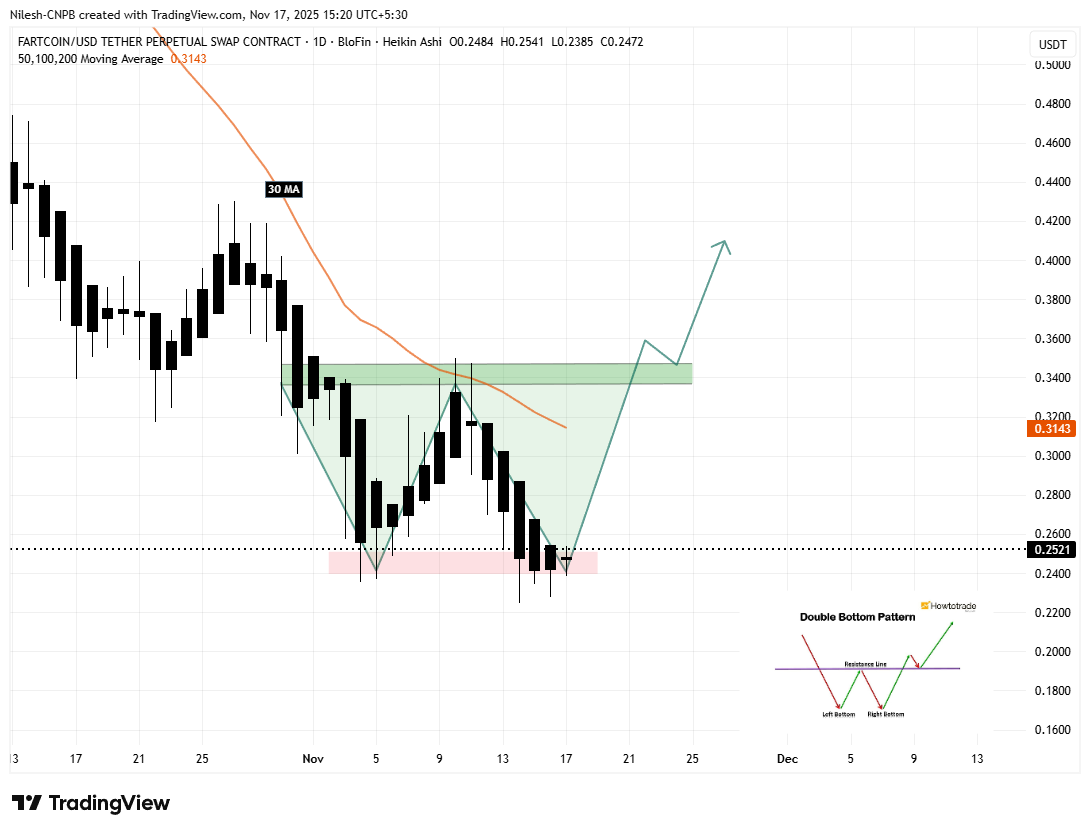
With the price rebounding from the highlighted support box and heading back toward the broader consolidation range, the structure is starting to resemble a textbook double-bottom formation.
What’s Next for FARTCOIN?
The key focus remains on the $0.24 support area. Holding above this level is crucial for keeping the bullish pattern intact. If momentum continues to build from this zone, FARTCOIN’s next major test lies at the 30-day moving average, currently hovering near $0.3143. This level also aligns with the upper boundary of the previous consolidation region, making it an important resistance to watch.
A strong breakout above the 30-day MA could trigger a much broader recovery, with the double-bottom breakout target sitting around $0.4550 — nearly 79% higher than the current price.
However, if the token fails to defend the $0.22–$0.24 support range, the bullish structure would be invalidated, leaving room for deeper downside pressure. Traders will need to monitor how price behaves as it approaches the neckline zone in the coming days.
Disclaimer: The views and analysis presented in this article are for informational purposes only and reflect the author’s perspective, not financial advice. Technical patterns and indicators discussed are subject to market volatility and may or may not yield the anticipated results. Investors are advised to exercise caution, conduct independent research, and make decisions aligned with their individual risk tolerance.

The opinions and market insights shared on CoinsProbe represent the views of individual authors based on prevailing market conditions at the time of publication. Cryptocurrency investments carry significant risk and volatility. Readers are encouraged to conduct their own research and seek professional financial advice before making investment decisions. CoinsProbe and its contributors do not accept responsibility for financial losses or decisions made based on published content.
CoinsProbe may publish sponsored articles, affiliate links, or promotional collaborations. All sponsored material is clearly labeled to maintain transparency with our audience. Our editorial decisions remain fully independent, and advertising partnerships do not influence reviews, rankings, or published opinions.
Since 2023, CoinsProbe has delivered reliable insights on cryptocurrency, blockchain, and digital assets. Our content is created by experienced researchers and analysts who follow strict editorial standards focused on accuracy, transparency, and credibility. Every article is carefully reviewed and verified using trusted sources and current market data. We provide unbiased analysis and timely updates covering everything from emerging crypto projects to major industry developments.