
Key Takeaway:
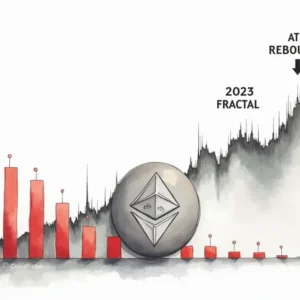
Ethereum is consolidating 40% below its ATH while a repeating fractal pattern, stabilizing RSI, and record on-chain transactions suggest a potential bullish continuation.
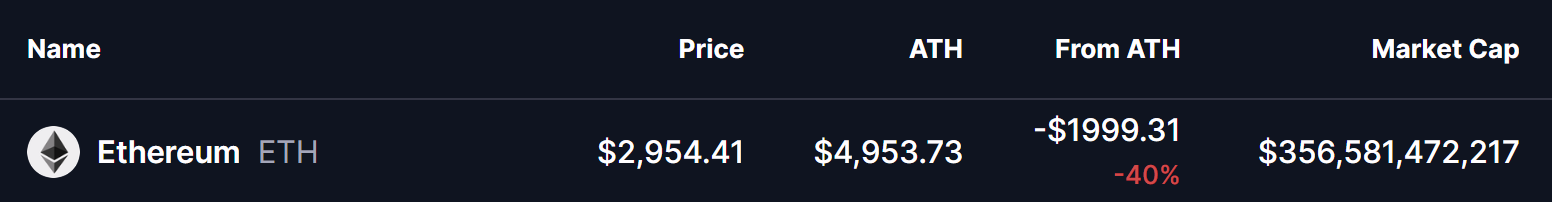
Ethereum (ETH) is currently trading near $2,950, sitting roughly 40% below its all-time high around $4,950. While that gap may appear bearish at first glance, historical market cycles suggest that this type of distance from ATH often occurs during mid-cycle consolidation phases, not at major market tops.
Rather than signaling weakness, ETH’s current structure reflects a market that is resetting, building support, and preparing for its next directional move — a view reinforced by long-term technical patterns and rising on-chain activity.
Fractal Analysis With RSI: A Familiar Market Rhythm
According to the latest chart shared by crypto analyst Javon Marks, Ethereum appears to be following a repeating fractal structure that has emerged multiple times across previous market cycles.
This fractal roadmap highlights a consistent and familiar sequence:
- A strong impulsive rally
- A prolonged consolidation phase
- The formation of higher lows
- A breakout continuation toward new highs
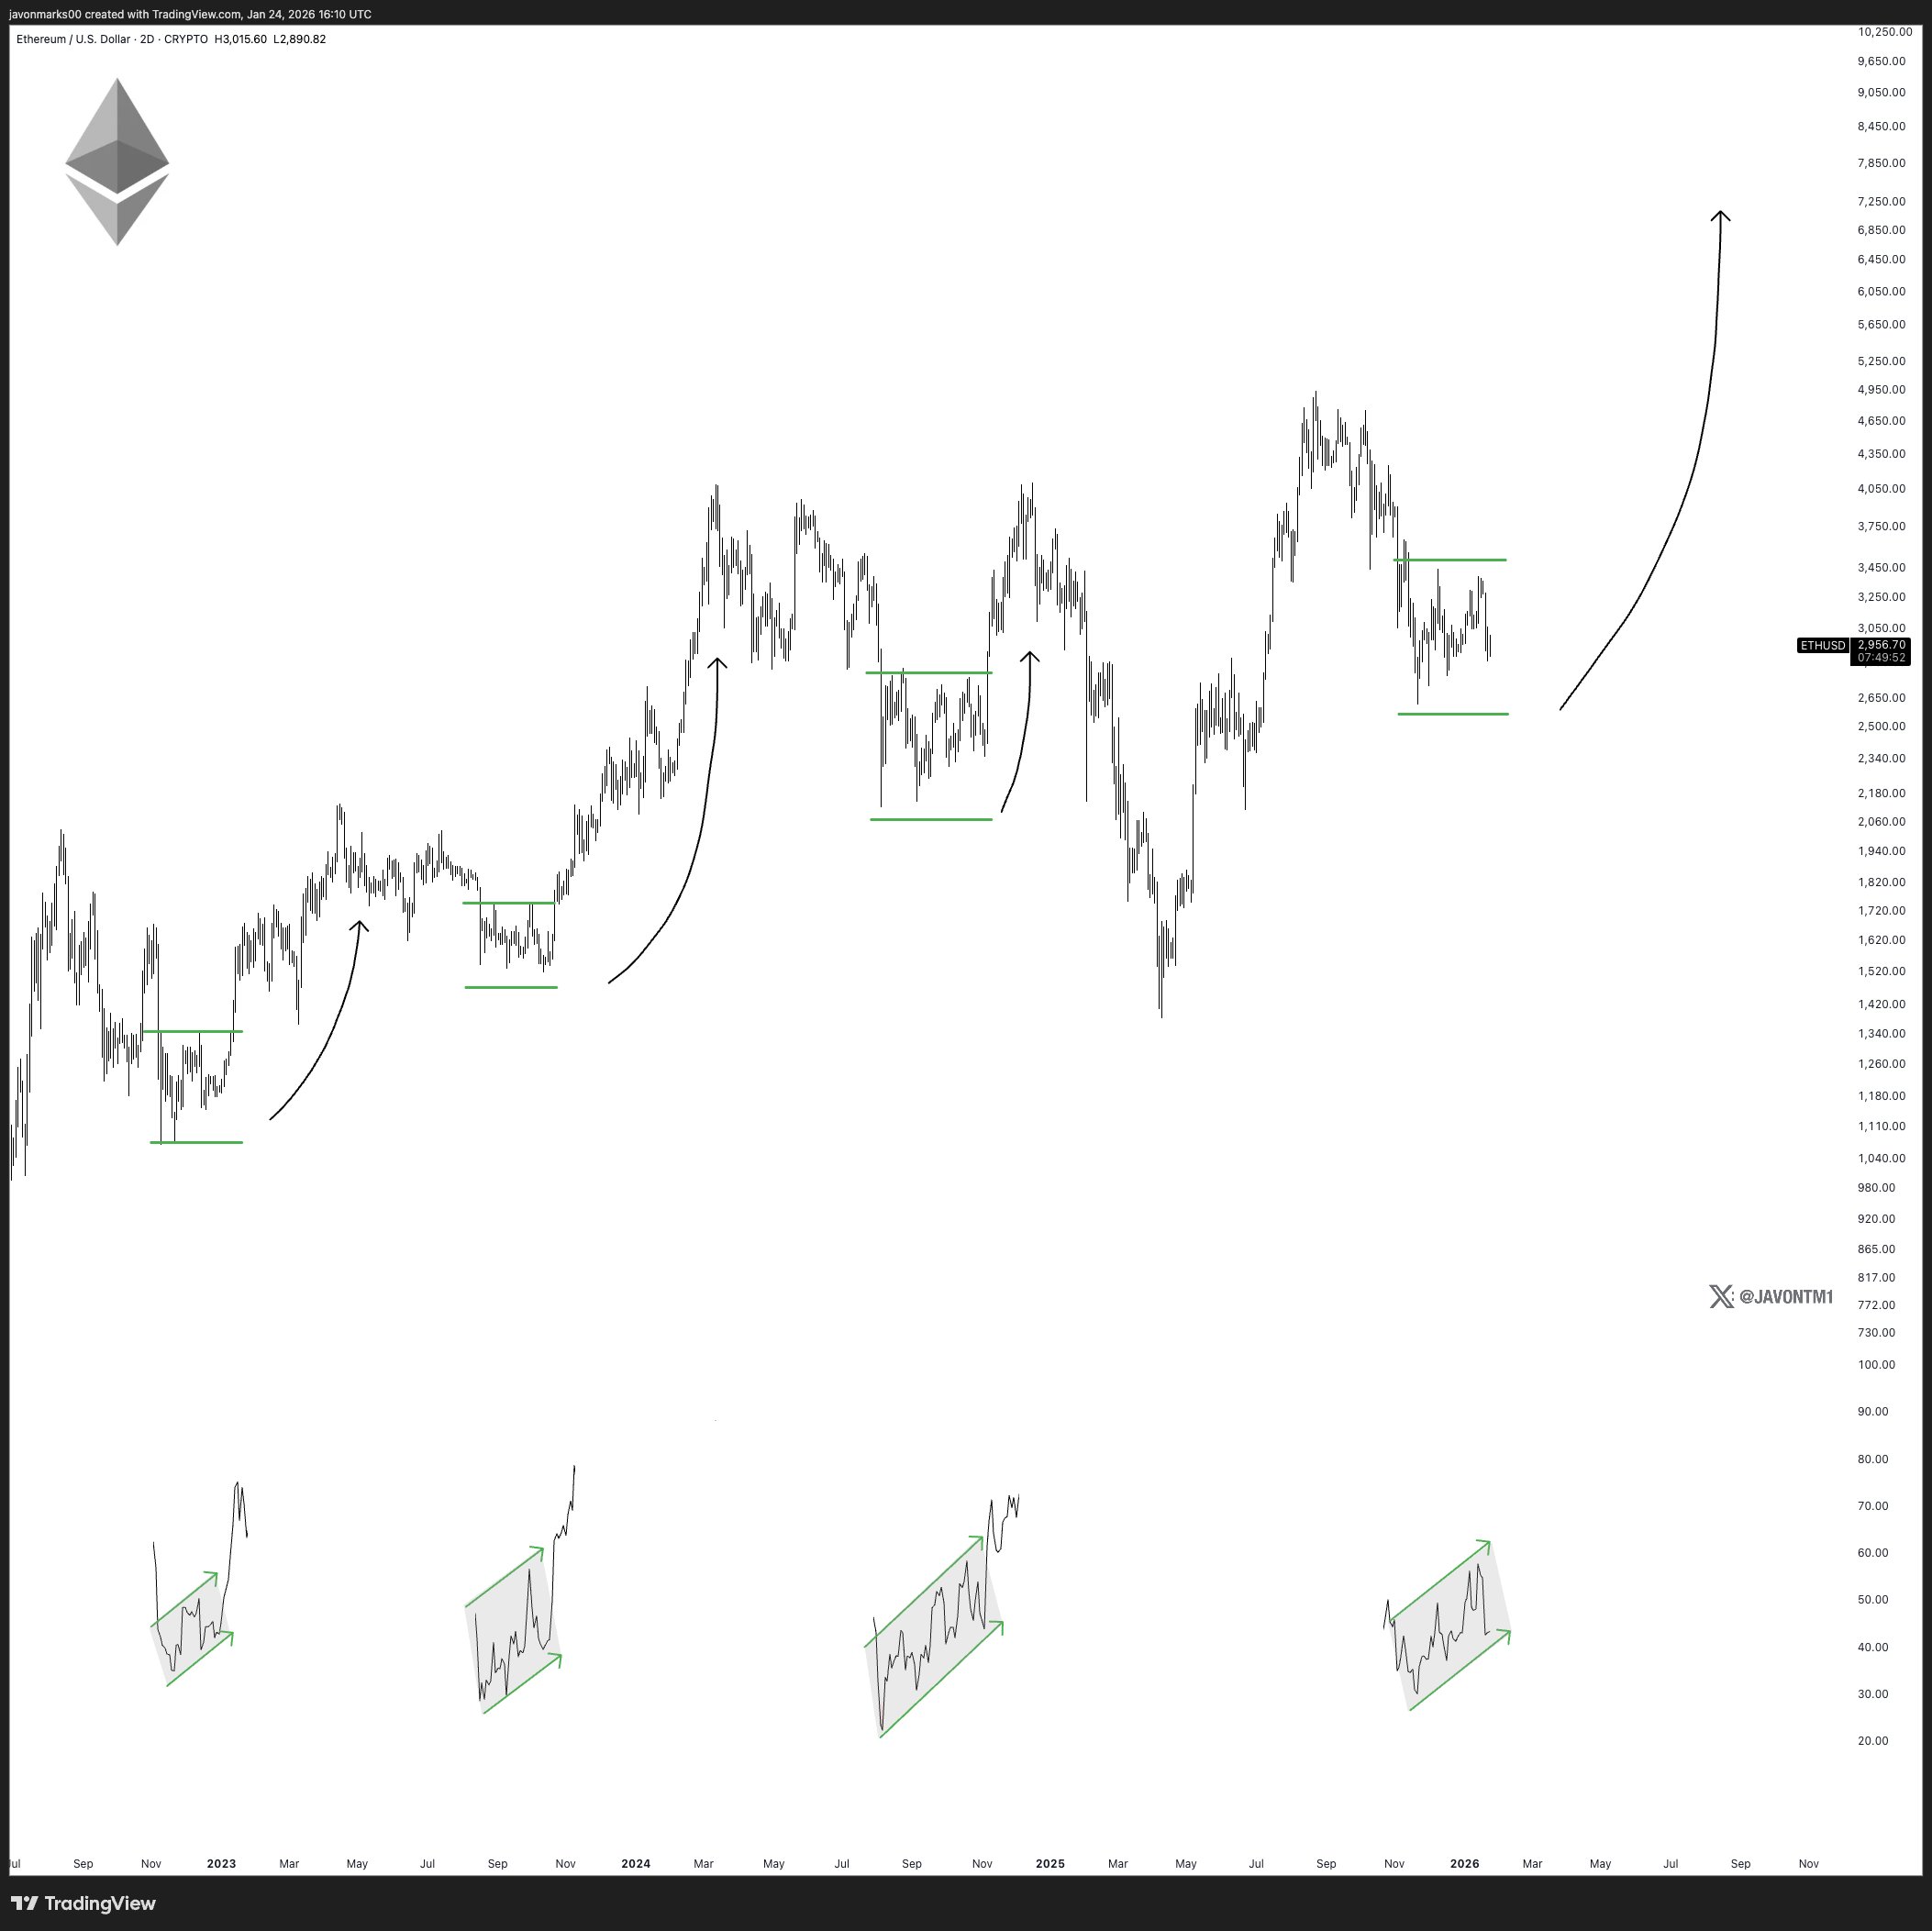
Each prior occurrence of this structure ultimately resolved to the upside once consolidation matured.
What makes the current setup particularly compelling is the RSI behavior. In previous cycles shown on the chart, Ethereum’s RSI cooled off from overbought levels during consolidation phases before re-expanding upward just ahead of major price advances.
At present, RSI appears to be stabilizing rather than breaking down, suggesting momentum is being recharged instead of exhausted. Historically, this type of RSI structure has aligned more closely with accumulation phases, not distribution — especially when paired with higher-low price action.
On-Chain Confirmation: Network Activity Is Rising
Beyond technicals, Ethereum’s on-chain data adds another layer of confirmation.
The network recently recorded 2.88 million transactions in a single day, marking the highest daily transaction count in Ethereum’s history on January 16. This surge in activity highlights sustained demand for block space, decentralized applications, and settlement — even as price remains range-bound.
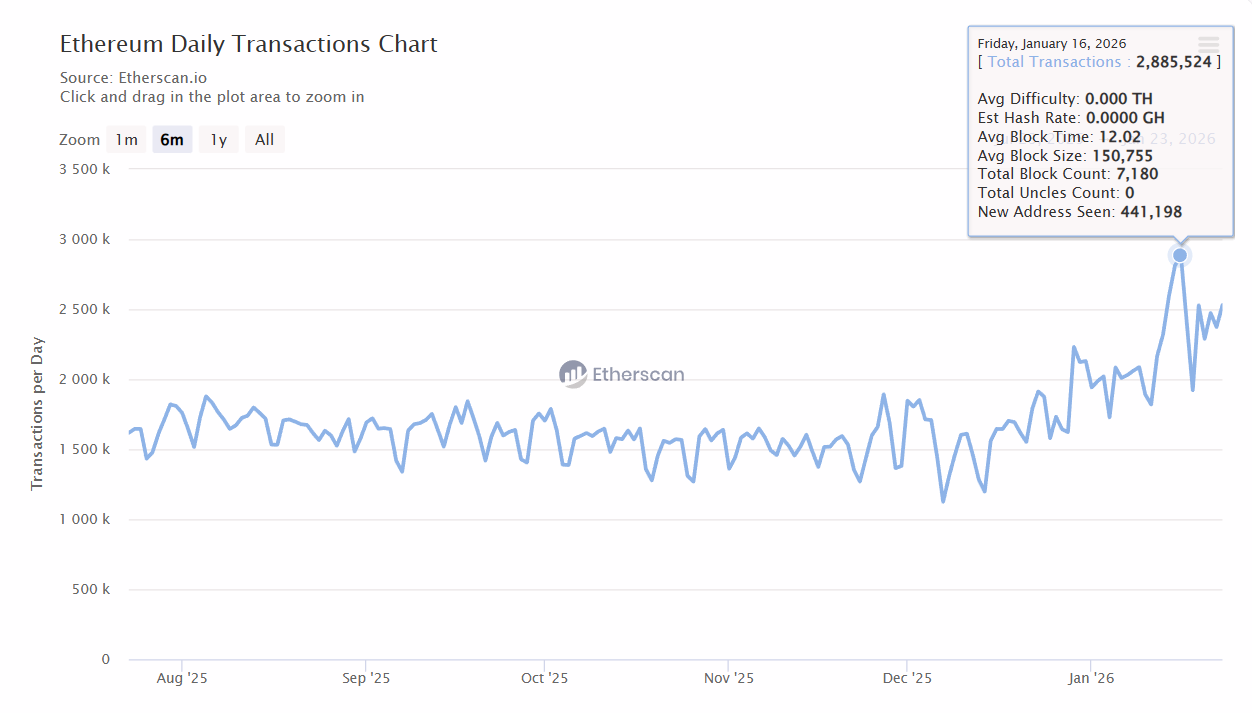
Historically, periods of rising network usage during sideways price action have often preceded larger directional moves, as utility and participation tend to lead price rather than follow it.
What to Watch Next?
For traders and long-term holders, several key signals stand out:
- A clean break above range resistance near $3,550
- RSI expansion confirming a return of bullish momentum
- Continued strength in network activity and transaction counts
- Broader risk-on sentiment across crypto markets
A confirmed breakout above resistance could shift Ethereum from consolidation into a renewed trend phase, while failure to hold key supports near $2,600 may extend the current range.
Final Thoughts
Ethereum’s current price action may feel quiet, but beneath the surface, structure is clearly forming. With ETH still 40% below ATH, a repeating fractal pattern highlighted by Javon Marks, stabilizing RSI, and record-breaking transaction activity on January 16, the market appears to be building rather than weakening.
As always, fractals are not guarantees. However, when technical structure and on-chain fundamentals align, they provide valuable insight into what could be coming next — and Ethereum’s roadmap suggests the market may be closer to expansion than exhaustion.
Disclaimer: The views and analysis presented in this article are for informational purposes only and reflect the author’s perspective, not financial advice. Technical patterns and indicators discussed are subject to market volatility and may or may not yield the anticipated results. Investors are advised to exercise caution, conduct independent research, and make decisions aligned with their individual risk tolerance.
About Author: Nilesh Hembade is the Founder and Lead Author of Coinsprobe, with over 5 years of experience in the cryptocurrency and blockchain industry. Since launching Coinsprobe in 2023, he has been providing daily, research-driven insights through in-depth market analysis, on-chain data, and technical research.

The opinions and market insights shared on CoinsProbe represent the views of individual authors based on prevailing market conditions at the time of publication. Cryptocurrency investments carry significant risk and volatility. Readers are encouraged to conduct their own research and seek professional financial advice before making investment decisions. CoinsProbe and its contributors do not accept responsibility for financial losses or decisions made based on published content.
CoinsProbe may publish sponsored articles, affiliate links, or promotional collaborations. All sponsored material is clearly labeled to maintain transparency with our audience. Our editorial decisions remain fully independent, and advertising partnerships do not influence reviews, rankings, or published opinions.
Since 2023, CoinsProbe has delivered reliable insights on cryptocurrency, blockchain, and digital assets. Our content is created by experienced researchers and analysts who follow strict editorial standards focused on accuracy, transparency, and credibility. Every article is carefully reviewed and verified using trusted sources and current market data. We provide unbiased analysis and timely updates covering everything from emerging crypto projects to major industry developments.