
Key Takeaways
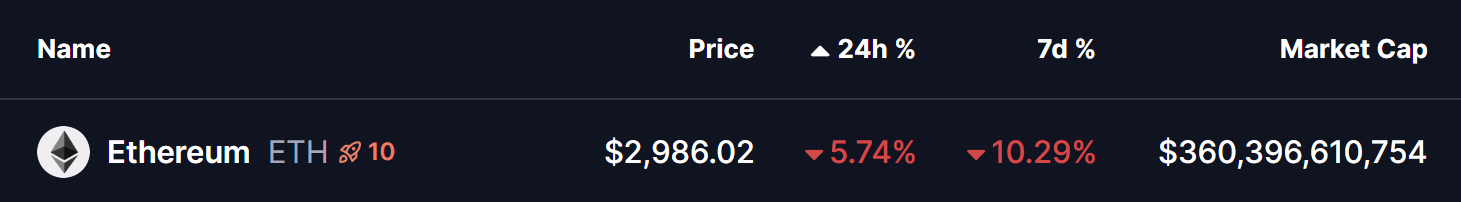
- Ethereum (ETH) has dropped over 10% this week, trading near $2,980 after rejecting the $3,400 resistance zone.
- Despite the sell-off, whales and institutions are aggressively accumulating ETH during the dip.
- On-chain data shows large purchases by Trend Research and an OTC whale via FalconX and Wintermute.
- ETH continues to trade within a long-term ascending triangle pattern on the daily chart.
- The rising trendline near $2,900 remains a critical support zone for a potential rebound.
- A reclaim of the 50-day moving average around $3,088 could revive bullish momentum toward $3,400.
As of January 21, 2026, Ethereum (ETH) is trading near $2,980, down roughly 5% on the day and more than 10% over the past week. The drop follows a rejection from Sunday’s local high around $3,360, as broader market sentiment soured.
This pullback hasn’t happened in isolation. Rising geopolitical tensions and growing fears around a global commodity super cycle have pushed investors into risk-off mode. Bitcoin (BTC) slipping below $90,000 only added fuel to the sell-off, dragging Ethereum and the wider altcoin market lower.
That said, beneath the surface, Ethereum’s structure still tells a more nuanced story.
Whales Step In on the Ethereum Dip
Despite the sharp correction, large players appear to be treating this dip as an opportunity rather than a warning sign.
On-chain data shared by Lookonchain shows that whales and institutions are actively accumulating ETH during the decline:
- Trend Research borrowed $70 million USDT from Aave and used it to purchase 24,555 ETH (worth ~$75.5 million). The firm now reportedly holds 651,310 ETH, valued at around $1.92 billion.
- An OTC whale wallet (0xFB7) acquired 20,000 ETH (approximately $58.8 million) via FalconX and Wintermute.
While short-term price action looks shaky, this kind of buying suggests that smart money may be positioning for a rebound rather than bracing for a deeper collapse.
Ascending Triangle Still Intact on the Daily Chart
Looking at the daily ETH chart, the broader technical structure remains constructive.
Ethereum continues to trade within a well-defined ascending triangle that has been forming since late 2025. This pattern is characterized by:
- A series of higher lows, supported by a rising trendline
- A strong horizontal resistance zone around $3,350–$3,400
During the latest sell-off, ETH once again pulled back toward its rising trendline support, currently sitting near the $2,900–$2,920 area. This zone has acted as a reliable demand region multiple times over the past few months.
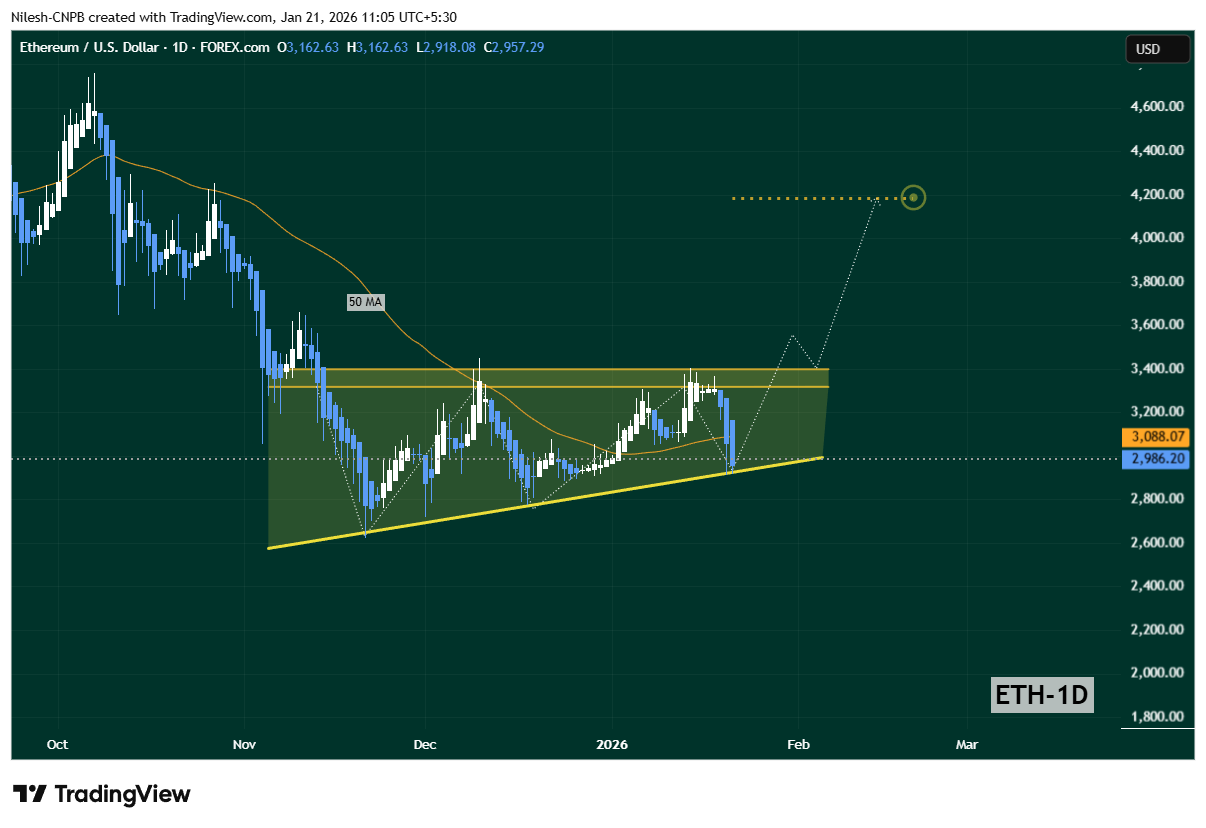
For now, price is hovering just above this support, suggesting buyers are still defending it. However, ETH remains below the 50-day moving average, which is currently near $3,088, indicating that short-term momentum has yet to fully recover.
What’s Next for ETH?
If Ethereum manages to hold the ascending trendline near $2,900, the structure of the ascending triangle remains valid. A successful reclaim of the 50-day moving average would be an important first step toward restoring bullish momentum.
Should that happen — especially if broader market conditions stabilize and Bitcoin finds support — ETH could once again make a run at the $3,400 resistance zone, where a breakout attempt would be back on the table.
That said, the risk is clear. A decisive daily close below the rising trendline would weaken the bullish thesis and could open the door to a deeper short-term correction.
For now, Ethereum sits at a critical inflection point — caught between macro-driven fear and quiet accumulation from deep-pocketed players watching the dip closely.
Disclaimer: The views and analysis presented in this article are for informational purposes only and reflect the author’s perspective, not financial advice. Technical patterns and indicators discussed are subject to market volatility and may or may not yield the anticipated results. Investors are advised to exercise caution, conduct independent research, and make decisions aligned with their individual risk tolerance.
About Author: Nilesh Hembade is the Founder and Lead Author of Coinsprobe, with over 5 years of experience in the cryptocurrency and blockchain industry. Since launching Coinsprobe in 2023, he has been providing daily, research-driven insights through in-depth market analysis, on-chain data, and technical research.

The opinions and market insights shared on CoinsProbe represent the views of individual authors based on prevailing market conditions at the time of publication. Cryptocurrency investments carry significant risk and volatility. Readers are encouraged to conduct their own research and seek professional financial advice before making investment decisions. CoinsProbe and its contributors do not accept responsibility for financial losses or decisions made based on published content.
CoinsProbe may publish sponsored articles, affiliate links, or promotional collaborations. All sponsored material is clearly labeled to maintain transparency with our audience. Our editorial decisions remain fully independent, and advertising partnerships do not influence reviews, rankings, or published opinions.
Since 2023, CoinsProbe has delivered reliable insights on cryptocurrency, blockchain, and digital assets. Our content is created by experienced researchers and analysts who follow strict editorial standards focused on accuracy, transparency, and credibility. Every article is carefully reviewed and verified using trusted sources and current market data. We provide unbiased analysis and timely updates covering everything from emerging crypto projects to major industry developments.