
Key Takeaways
- Ethereum has pulled back below $2,900, but large whales and institutions are actively buying the dip.
- ETH’s chart is forming a bullish Shark harmonic pattern, often seen near potential market bottoms.
- Holding above the $2,784 support keeps the rebound scenario alive, with $3,062 as the first upside target.
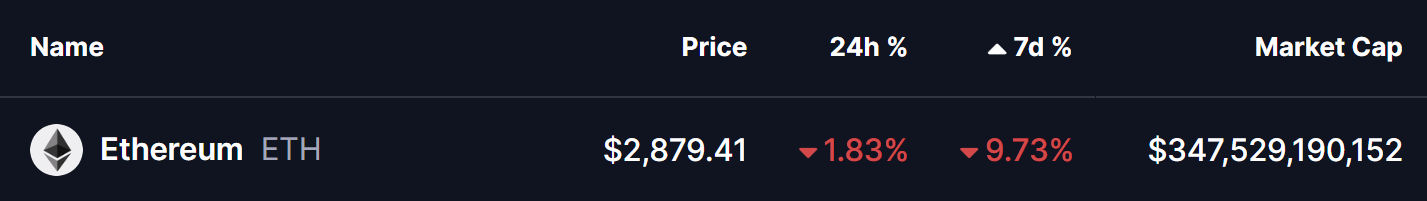
The broader cryptocurrency market has once again turned lower after a strong start to the year that pushed Ethereum (ETH) above the $3,400 mark. Since then, sentiment has cooled, with ETH sliding below $2,900 and posting a decline of over 9% in the past week as risk appetite across the market weakened.
Despite the short-term pullback, activity beneath the surface tells a more nuanced story. Recent whale and institutional movements, combined with Ethereum’s evolving chart structure, suggest that selling pressure may be slowing — and a rebound could be starting to take shape.
Whales and Institutions Step In on the Ethereum Dip
According to the latest on-chain data shared by Lookonchain, large players have been actively accumulating ETH during this market dip.
As prices fell, an OTC whale address (0xFB7) added another 20,000 ETH worth approximately $56.13 million just six hours ago. Over the past five days alone, this same whale has accumulated a massive 70,013 ETH, totaling roughly $203.6 million — a strong signal of confidence at current price levels.
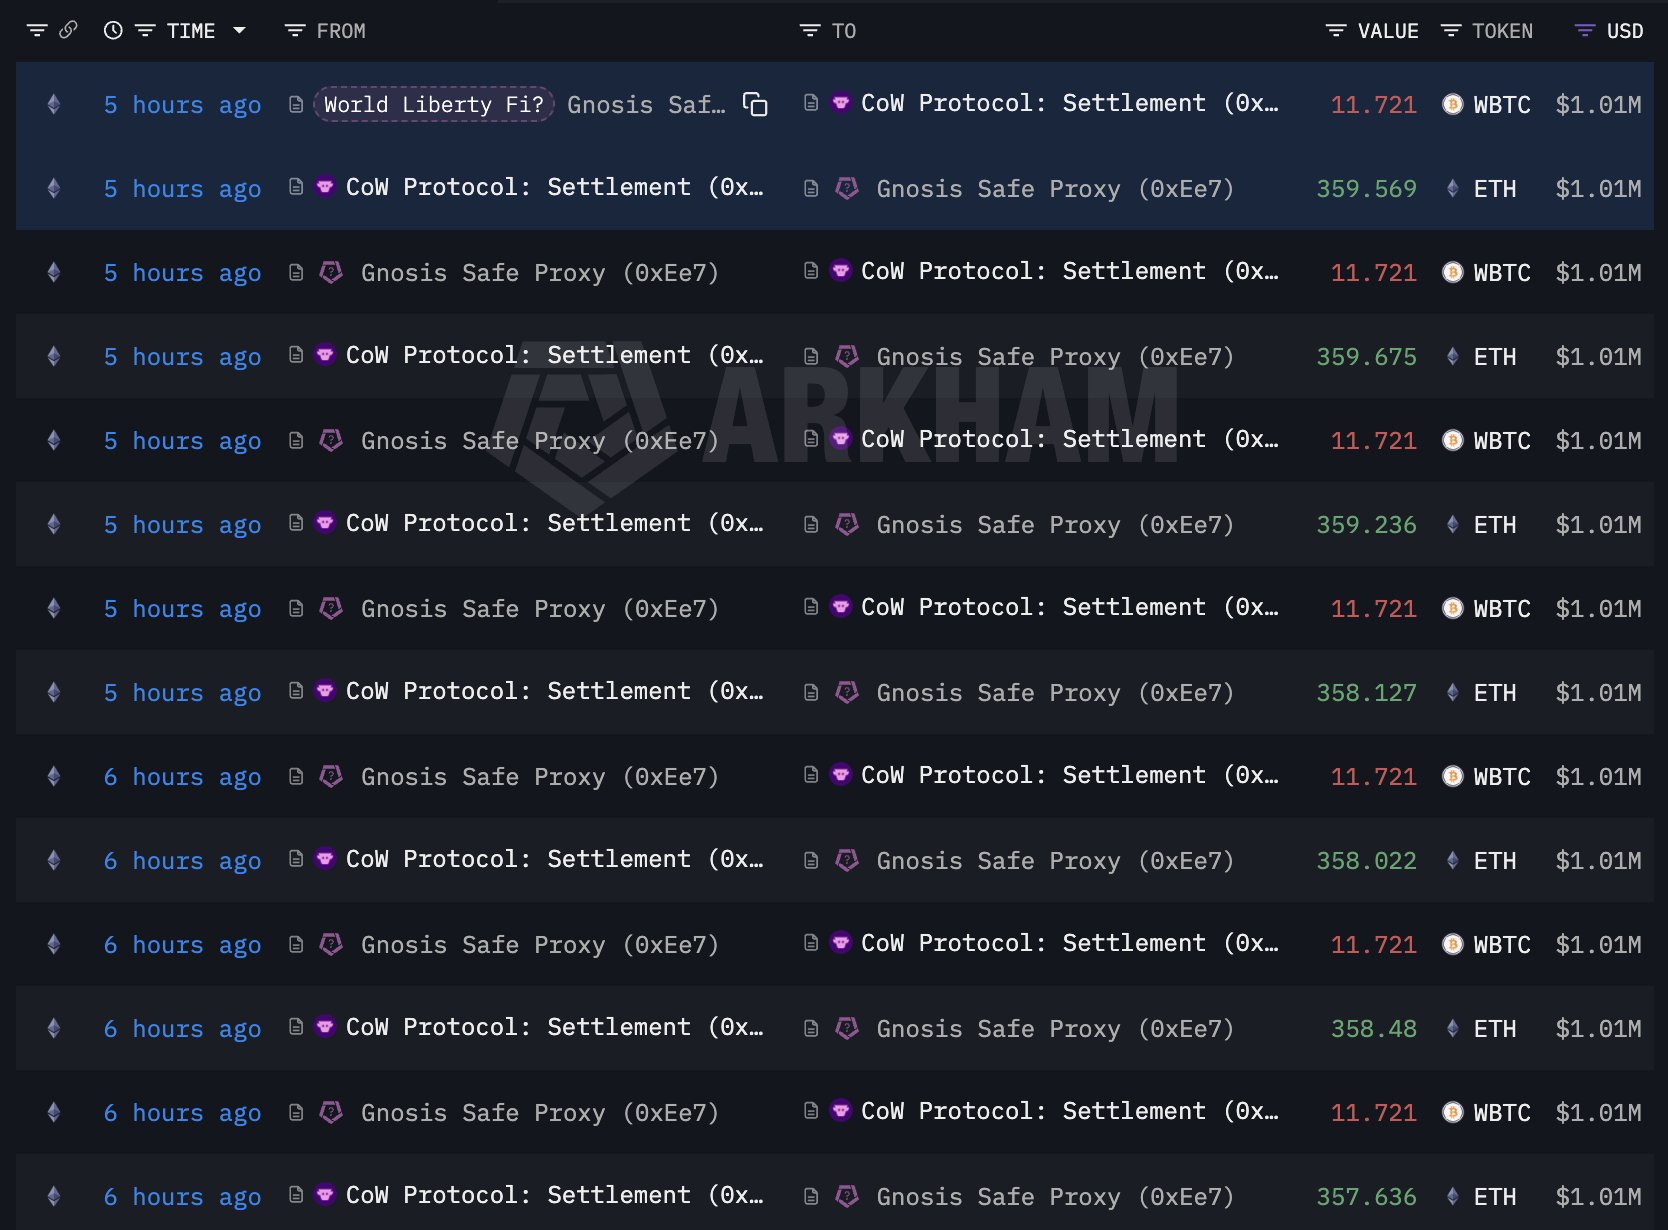
At the same time, institutional rotation appears to be underway. World Liberty Finance (WLFI) has begun shifting exposure away from Bitcoin and into Ethereum. Around six hours ago, the fund swapped 93.77 WBTC (valued at $8.08 million) for 2,868 ETH, reinforcing the view that larger players see value emerging in ETH after the recent correction.
Harmonic Pattern Signals a Possible Rebound
From a technical perspective, Ethereum’s 4-hour chart is flashing a potentially constructive setup. ETH appears to be completing a Bullish Shark harmonic pattern, a structure that often forms near market lows when downside momentum becomes exhausted.
The pattern began with the initial O–X move around the $2,908 region, followed by a sharp rally toward point X near $3,306. Price then retraced aggressively toward point A before making another push higher, forming point B close to $3,406. However, that advance failed to hold, leading to a renewed sell-off that appears to have completed point C near $2,784.
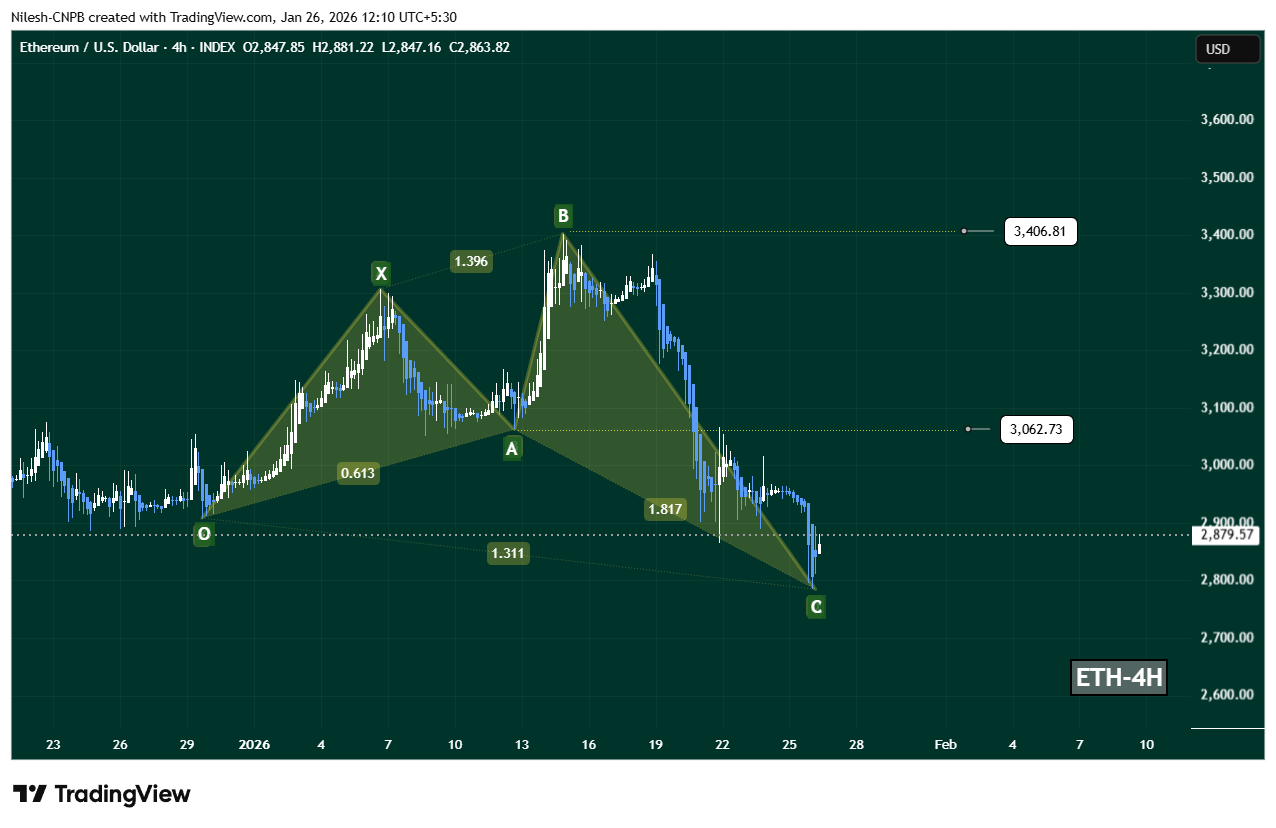
This C-leg zone is considered the potential reversal area in a Shark pattern. Notably, after touching this region, ETH has already shown early signs of stabilization, bouncing back toward the $2,880 area — an initial response that suggests selling pressure may be weakening.
What’s Next for ETH?
If the harmonic structure continues to play out, Ethereum could be positioning for a short-term rebound from current levels. The first upside area to watch sits around $3,062, which aligns closely with the prior A-point and acts as a key recovery level.
A stronger bullish follow-through could eventually bring the $3,406 region back into focus — the B-leg high and a major resistance zone where sellers previously stepped in.
That said, this bullish scenario remains conditional. A sustained breakdown below the $2,784 support zone would invalidate the Shark pattern and tilt momentum back in favor of the bears, potentially opening the door for deeper downside continuation.
Bottom Line
While Ethereum’s price has cooled sharply after its early-year rally, whale accumulation and institutional rotation suggest growing confidence at current levels. Combined with a developing bullish Shark harmonic pattern on the 4-hour chart, ETH may be entering a stabilization phase that could precede a rebound.
However, confirmation is still needed. As long as ETH holds above the $2,784 zone, the technical and on-chain signals lean cautiously bullish — but a failure to defend this level would shift the outlook back to the downside.
Disclaimer: The views and analysis presented in this article are for informational purposes only and reflect the author’s perspective, not financial advice. Technical patterns and indicators discussed are subject to market volatility and may or may not yield the anticipated results. Investors are advised to exercise caution, conduct independent research, and make decisions aligned with their individual risk tolerance.
About Author: Nilesh Hembade is the Founder and Lead Author of Coinsprobe, with over 5 years of experience in the cryptocurrency and blockchain industry. Since launching Coinsprobe in 2023, he has been providing daily, research-driven insights through in-depth market analysis, on-chain data, and technical research.

The opinions and market insights shared on CoinsProbe represent the views of individual authors based on prevailing market conditions at the time of publication. Cryptocurrency investments carry significant risk and volatility. Readers are encouraged to conduct their own research and seek professional financial advice before making investment decisions. CoinsProbe and its contributors do not accept responsibility for financial losses or decisions made based on published content.
CoinsProbe may publish sponsored articles, affiliate links, or promotional collaborations. All sponsored material is clearly labeled to maintain transparency with our audience. Our editorial decisions remain fully independent, and advertising partnerships do not influence reviews, rankings, or published opinions.
Since 2023, CoinsProbe has delivered reliable insights on cryptocurrency, blockchain, and digital assets. Our content is created by experienced researchers and analysts who follow strict editorial standards focused on accuracy, transparency, and credibility. Every article is carefully reviewed and verified using trusted sources and current market data. We provide unbiased analysis and timely updates covering everything from emerging crypto projects to major industry developments.