
Key Takeaways
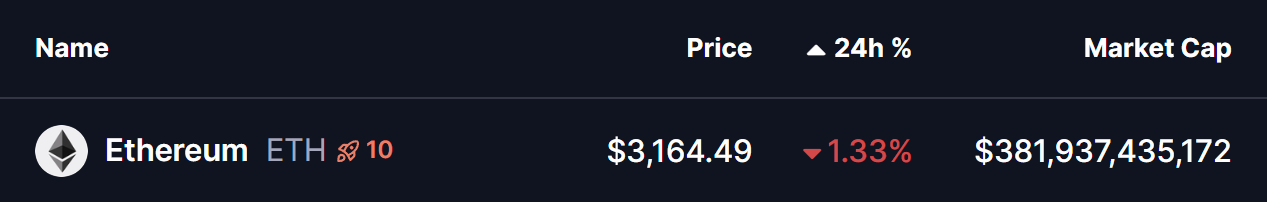
- Ethereum (ETH) is trading near $3,160 after a broader market pullback driven by macro uncertainty.
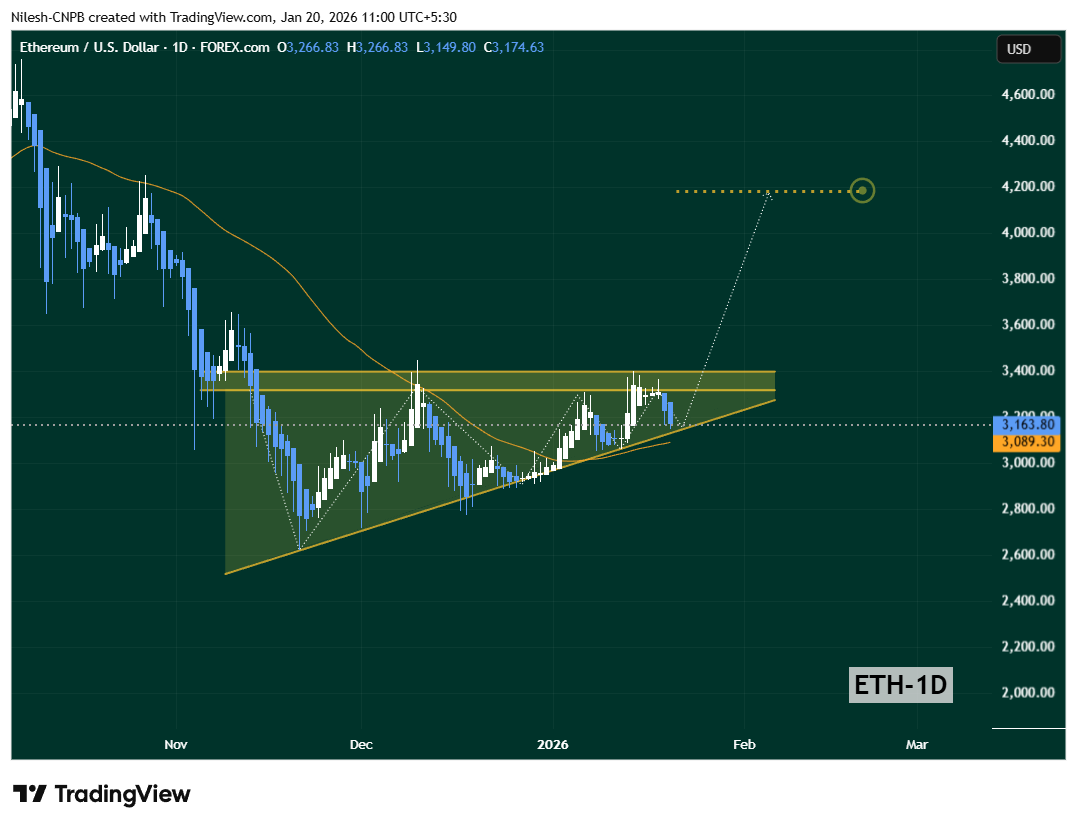
- The ascending triangle pattern on the daily chart remains intact, signaling a bullish structure.
- Price is approaching a critical ascending trendline support around $3,130–$3,150.
- Historically, buyers have defended this zone, increasing the chances of a short-term rebound.
- A confirmed breakdown below trendline support could weaken the bullish outlook in the near term.
As of January 20, 2026, Ethereum (ETH) is trading in the red near $3,164, down 1.33% from its Sunday high of around $3,367. The pullback comes amid a broader market downturn sparked by escalating US–EU trade tensions, which have pushed Bitcoin (BTC) below $92,000 and dragged major altcoins, including ETH, lower.
While short-term sentiment has clearly taken a hit, Ethereum’s overall technical structure remains constructive, suggesting this move may be more of a controlled pullback than the start of a deeper breakdown.
Ascending Triangle Still Intact on the Daily Chart
Looking at the daily chart, Ethereum continues to trade within a well-defined ascending triangle pattern that has been developing since late 2025. This structure is marked by a sequence of higher lows, supported by a rising trendline, pressing against a strong horizontal resistance zone near $3,400.
During the latest upswing, ETH once again tested this resistance area but failed to break through convincingly. The rejection triggered the current pullback, with price now gradually drifting lower toward the ascending trendline support, which has consistently acted as a demand zone over the past few months.
This price behavior suggests the current dip is part of a broader consolidation within the triangle, rather than a bearish trend reversal.
Key Support Zone Under the Spotlight
As ETH trades around $3,160, attention is shifting toward the $3,130–$3,150 zone, where the ascending trendline converges with previous reaction points on the chart.
If Ethereum dips slightly further into this region and buyers step in with conviction, it would strengthen the bullish case and keep the ascending triangle firmly in play. Historically, this support has attracted aggressive buying, often leading to sharp rebounds back toward the upper resistance band.
A solid bounce from this area could set the stage for another attempt at the $3,400 resistance, especially if broader market conditions stabilize and Bitcoin finds its footing.
What Could Invalidate the Bullish Setup?
While the structure remains bullish for now, the risk is clear. A decisive daily close below the rising trendline would weaken the ascending triangle thesis and open the door for deeper downside in the short term.
Such a breakdown would suggest that buyers are losing control, potentially exposing ETH to a move toward lower support zones as traders reassess risk amid ongoing macro uncertainty.
Bottom Line
Ethereum is currently sitting at a make-or-break technical level. Despite macro-driven volatility and risk-off sentiment across global markets, ETH’s chart still favors a potential rebound as long as the ascending trendline support continues to hold.
For now, this looks like a healthy pullback within a larger consolidation, not a structural breakdown. The next reaction near trendline support will be critical. If bulls defend it once again, Ethereum could be setting up for another push toward the top of the triangle.
Disclaimer: The views and analysis presented in this article are for informational purposes only and reflect the author’s perspective, not financial advice. Technical patterns and indicators discussed are subject to market volatility and may or may not yield the anticipated results. Investors are advised to exercise caution, conduct independent research, and make decisions aligned with their individual risk tolerance.
About Author: Nilesh Hembade is the Founder and Lead Author of Coinsprobe, with over 5 years of experience in the cryptocurrency and blockchain industry. Since launching Coinsprobe in 2023, he has been providing daily, research-driven insights through in-depth market analysis, on-chain data, and technical research.

The opinions and market insights shared on CoinsProbe represent the views of individual authors based on prevailing market conditions at the time of publication. Cryptocurrency investments carry significant risk and volatility. Readers are encouraged to conduct their own research and seek professional financial advice before making investment decisions. CoinsProbe and its contributors do not accept responsibility for financial losses or decisions made based on published content.
CoinsProbe may publish sponsored articles, affiliate links, or promotional collaborations. All sponsored material is clearly labeled to maintain transparency with our audience. Our editorial decisions remain fully independent, and advertising partnerships do not influence reviews, rankings, or published opinions.
Since 2023, CoinsProbe has delivered reliable insights on cryptocurrency, blockchain, and digital assets. Our content is created by experienced researchers and analysts who follow strict editorial standards focused on accuracy, transparency, and credibility. Every article is carefully reviewed and verified using trusted sources and current market data. We provide unbiased analysis and timely updates covering everything from emerging crypto projects to major industry developments.