
Date: Sun, March 23, 2025 | 05:45 AM GMT
The crypto market is showing minor signs of a rebound as Ethereum (ETH) bounces back with a 4% weekly gain, giving altcoins some breathing room after months of selling pressure.
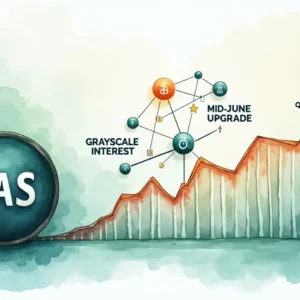
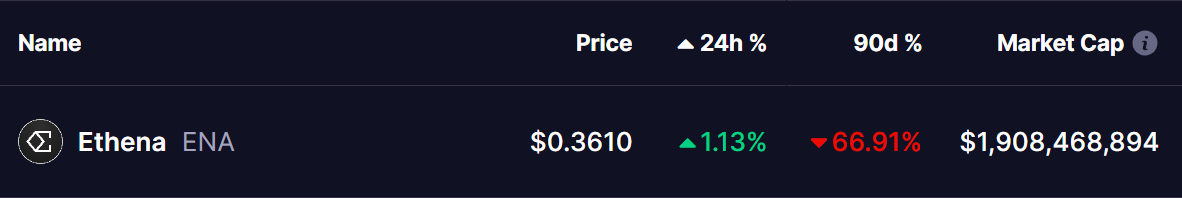
During this downtrend, Ethena (ENA) has taken a heavy hit, plunging over 66% in the last 90 days. However, as market sentiment gradually improves, ENA’s ongoing price action suggests that a recovery may be underway.
A Rounding Bottom in the Making?
ENA’s price has been in a steep decline since early January after facing rejection from its all-time high of $1.32. The aggressive sell-off sent the token crashing over 70%, eventually finding a base around the $0.33 level.

After weeks of consolidation, the current price action suggests that ENA may be forming a Rounding Bottom pattern, a classic reversal formation that often marks the transition from a bearish phase to a new bullish trend.
Will This Pattern Spark a Recovery?
For this pattern to fully play out, ENA must break through its overhead resistance zone, particularly around the 50-day moving average. A decisive move above this level would validate the rounding bottom and open the door for a much larger recovery. Historically, when assets complete this pattern, the upside target often extends toward previous highs, meaning ENA could aim for the $1.30 region in the coming months.
Adding to the bullish case, the MACD indicator is showing early signs of a bullish crossover, suggesting that selling pressure is weakening. If buying volume increases in the coming days, it could further confirm the shift in momentum and reinforce the idea that ENA is entering a recovery phase.
Final Thoughts
ENA appears to be at a turning point, with the rounding bottom pattern signaling a potential trend reversal. A breakout above key resistance, particularly the 50-day MA, could ignite a strong rally toward previous highs. However, failure to hold support this zone may lead to further downside. Traders should watch price action closely as momentum builds.
Disclaimer: This article is for informational purposes only and not financial advice. Always conduct your own research before making any investment decisions.

The opinions and market insights shared on CoinsProbe represent the views of individual authors based on prevailing market conditions at the time of publication. Cryptocurrency investments carry significant risk and volatility. Readers are encouraged to conduct their own research and seek professional financial advice before making investment decisions. CoinsProbe and its contributors do not accept responsibility for financial losses or decisions made based on published content.
CoinsProbe may publish sponsored articles, affiliate links, or promotional collaborations. All sponsored material is clearly labeled to maintain transparency with our audience. Our editorial decisions remain fully independent, and advertising partnerships do not influence reviews, rankings, or published opinions.
Since 2023, CoinsProbe has delivered reliable insights on cryptocurrency, blockchain, and digital assets. Our content is created by experienced researchers and analysts who follow strict editorial standards focused on accuracy, transparency, and credibility. Every article is carefully reviewed and verified using trusted sources and current market data. We provide unbiased analysis and timely updates covering everything from emerging crypto projects to major industry developments.