
Key Takeaways
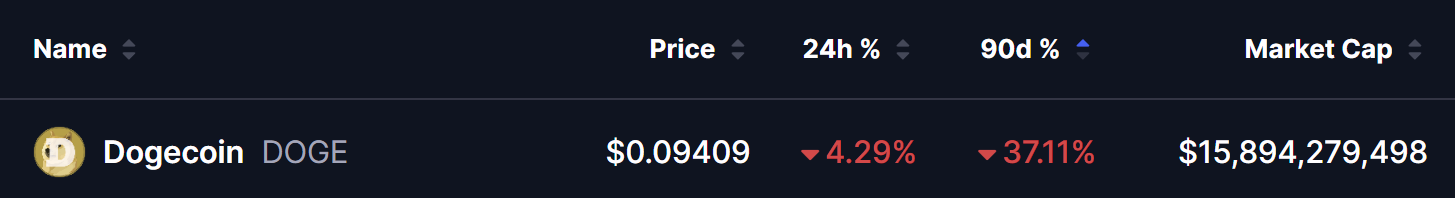
- DOGE has dropped nearly 37% in the past 90 days amid the broader crypto market downtrend.
- A 2-week chart fractal shows similarities between DOGE’s current structure and XRP’s historical breakout cycle.
- DOGE is consolidating within a large bull flag pattern after its 2020 symmetrical triangle breakout.
- The $0.080-$0.090 zone represents key lower-boundary support of the flag.
- A breakout above the flag resistance could trigger the next major expansion phase.
The broader cryptocurrency market has been locked in a deep downtrend over the past couple of months. Bitcoin (BTC) and Ethereum (ETH) have dropped roughly 27% and 35% respectively in the last 90 days. Memecoins have been hit even harder, with Dogecoin (DOGE) sliding nearly 37% during the same period.
However, beneath the surface of this correction, a larger structural pattern is beginning to attract attention — and it suggests that DOGE may be approaching a key inflection point.
DOGE Mirrors XRP’s Historical Structure
According to a two-week timeframe analysis shared by crypto analyst CryptoBullet, Dogecoin’s current structure closely resembles the historical price behavior of XRP.
Back in 2017, XRP formed a symmetrical triangle during its accumulation phase. Once price broke out of that structure, it triggered a powerful rally. After the breakout, XRP entered a prolonged multi-year consolidation within a broad bull flag formation.
Eventually, XRP broke out of that bull flag structure last year, leading to another strong upside expansion.
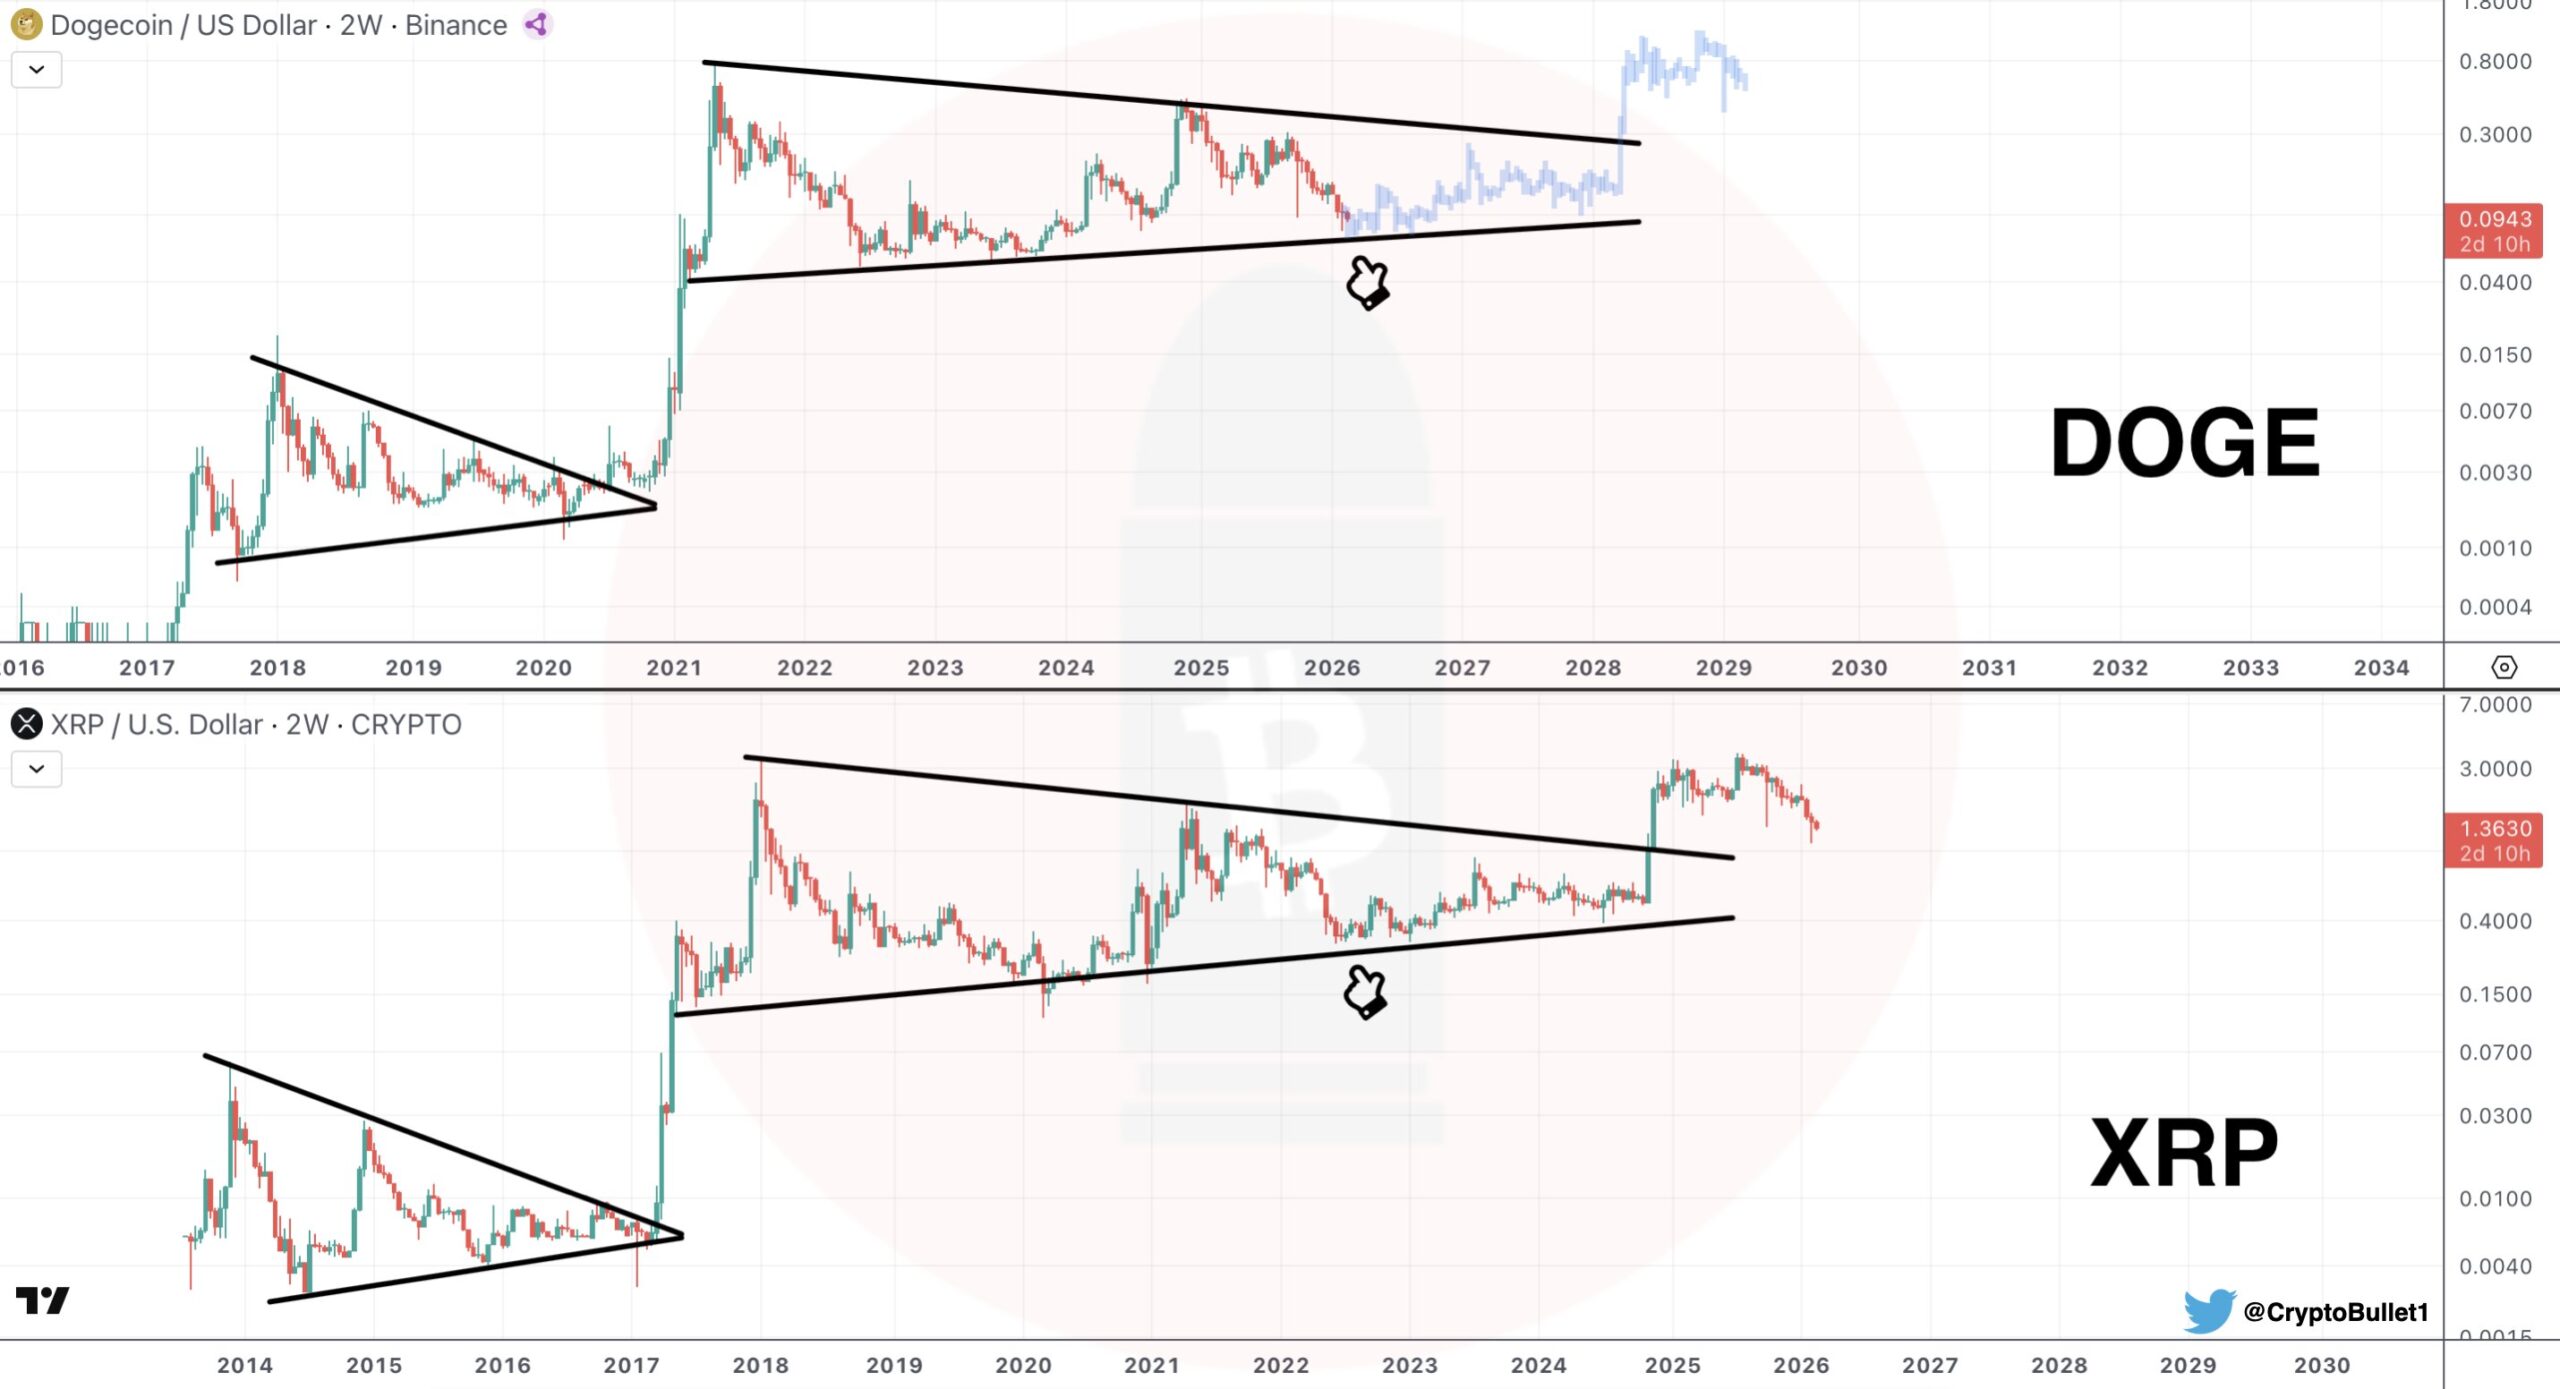
Now, DOGE appears to be following a similar roadmap.
In late 2020, Dogecoin also broke out from a symmetrical triangle, launching into a historic rally. Since then, price action has been consolidating within a large bull flag pattern on the two-week chart.
The recent downtrend has pushed DOGE toward the lower boundary of this flag, which currently sits near the $0.080-$0.090 region. This area represents a major structural support zone within the broader bullish framework.
If the fractal comparison holds, this pullback could represent a higher-timeframe retest rather than the start of a prolonged breakdown.
What’s Next for DOGE?
If this fractal continues to play out, DOGE could form a macro bottom near the $0.080-$0.090 lower boundary support of the flag structure.
From there, signs of stabilization — such as higher lows on lower timeframes or strong bullish weekly closes — could signal the early stages of a reversal. A confirmed breakout above the upper boundary of the bull flag would likely mark the next major expansion phase.
In fractal terms, the current weakness may be part of a broader consolidation before a larger upside move unfolds.
Key Risk: Fractals Are Not Guarantees
While fractal comparisons can provide valuable perspective, they are not predictive certainties.
Market conditions differ across cycles. XRP’s breakout occurred under a unique macro and liquidity environment. DOGE’s trajectory will depend on broader market sentiment, Bitcoin’s direction, and overall risk appetite.
A breakdown below the lower boundary of the bull flag would invalidate the fractal comparison and potentially shift the long-term structure toward a more bearish outlook.
For now, DOGE’s higher-timeframe structure remains intact — but the coming weeks could determine whether this fractal analogy becomes reality or fades into coincidence.
Disclaimer: The views and analysis presented in this article are for informational purposes only and reflect the author’s perspective, not financial advice. Technical patterns and indicators discussed are subject to market volatility and may or may not yield the anticipated results. Investors are advised to exercise caution, conduct independent research, and make decisions aligned with their individual risk tolerance.
About Author: Nilesh Hembade is the Founder and Lead Author of Coinsprobe, with over 5 years of experience in the cryptocurrency and blockchain industry. Since launching Coinsprobe in 2023, he has been providing daily, research-driven insights through in-depth market analysis, on-chain data, and technical research.

The opinions and market insights shared on CoinsProbe represent the views of individual authors based on prevailing market conditions at the time of publication. Cryptocurrency investments carry significant risk and volatility. Readers are encouraged to conduct their own research and seek professional financial advice before making investment decisions. CoinsProbe and its contributors do not accept responsibility for financial losses or decisions made based on published content.
CoinsProbe may publish sponsored articles, affiliate links, or promotional collaborations. All sponsored material is clearly labeled to maintain transparency with our audience. Our editorial decisions remain fully independent, and advertising partnerships do not influence reviews, rankings, or published opinions.
Since 2023, CoinsProbe has delivered reliable insights on cryptocurrency, blockchain, and digital assets. Our content is created by experienced researchers and analysts who follow strict editorial standards focused on accuracy, transparency, and credibility. Every article is carefully reviewed and verified using trusted sources and current market data. We provide unbiased analysis and timely updates covering everything from emerging crypto projects to major industry developments.