Date: Fri, Aug 08, 2025 | 06:50 AM GMT
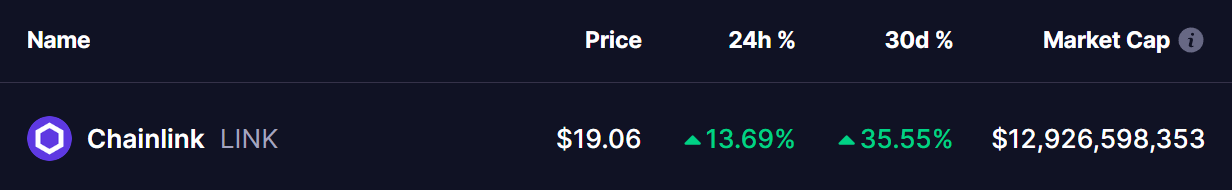
The cryptocurrency market is gaining strong upside momentum again as Ethereum (ETH) reclaims the $3,900 level for the first time since late 2024. Riding that bullish wave, Chainlink (LINK) has emerged as a standout performer among major altcoins.
LINK surged 13% today, extending its monthly gain to more than 35%, and a developing harmonic pattern on its daily chart suggests there may still be more room for the rally to continue.
Harmonic Pattern Hints at Potential Bounce
On the daily timeframe, LINK is forming a Bearish ABCD harmonic pattern — a classic formation that, despite its name, typically involves a bullish CD leg before price reaches the potential reversal zone (PRZ).
The structure began with a sharp rally from point A around $13.20 to point B, then corrected down to point C near $15.44, where bulls stepped in again. The price has since rebounded and is now trading around $18.70, confirming that the CD leg is in full motion.
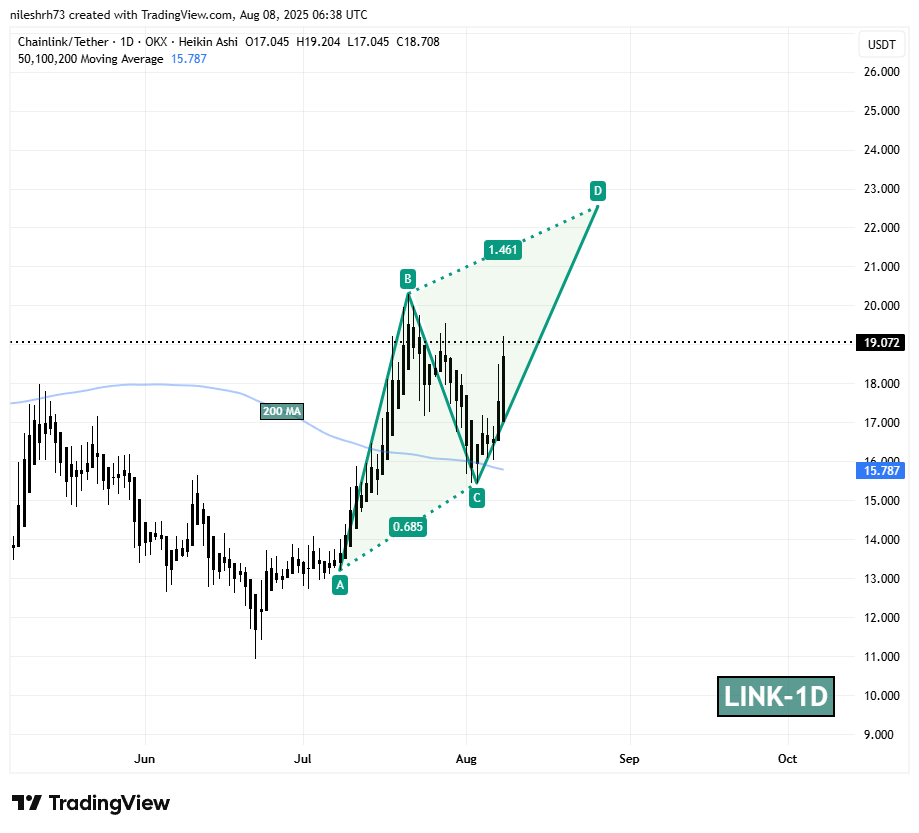
According to harmonic principles, the CD leg could extend toward the 1.461 Fibonacci projection of the BC leg, which targets a PRZ near $22.54. If realized, this would represent an additional 18–20% upside from current levels.
What’s Next for LINK?
The momentum appears to be building in LINK’s favor. A continued push toward the $22.54 area would complete the ABCD pattern, but this zone could also act as a strong resistance, potentially triggering short-term profit-taking or a pause in the uptrend.

Disclaimer: This article is for informational purposes only and does not constitute financial advice. Always do your own research before making investment decisions.

The opinions and market insights shared on CoinsProbe represent the views of individual authors based on prevailing market conditions at the time of publication. Cryptocurrency investments carry significant risk and volatility. Readers are encouraged to conduct their own research and seek professional financial advice before making investment decisions. CoinsProbe and its contributors do not accept responsibility for financial losses or decisions made based on published content.
CoinsProbe may publish sponsored articles, affiliate links, or promotional collaborations. All sponsored material is clearly labeled to maintain transparency with our audience. Our editorial decisions remain fully independent, and advertising partnerships do not influence reviews, rankings, or published opinions.
Since 2023, CoinsProbe has delivered reliable insights on cryptocurrency, blockchain, and digital assets. Our content is created by experienced researchers and analysts who follow strict editorial standards focused on accuracy, transparency, and credibility. Every article is carefully reviewed and verified using trusted sources and current market data. We provide unbiased analysis and timely updates covering everything from emerging crypto projects to major industry developments.