
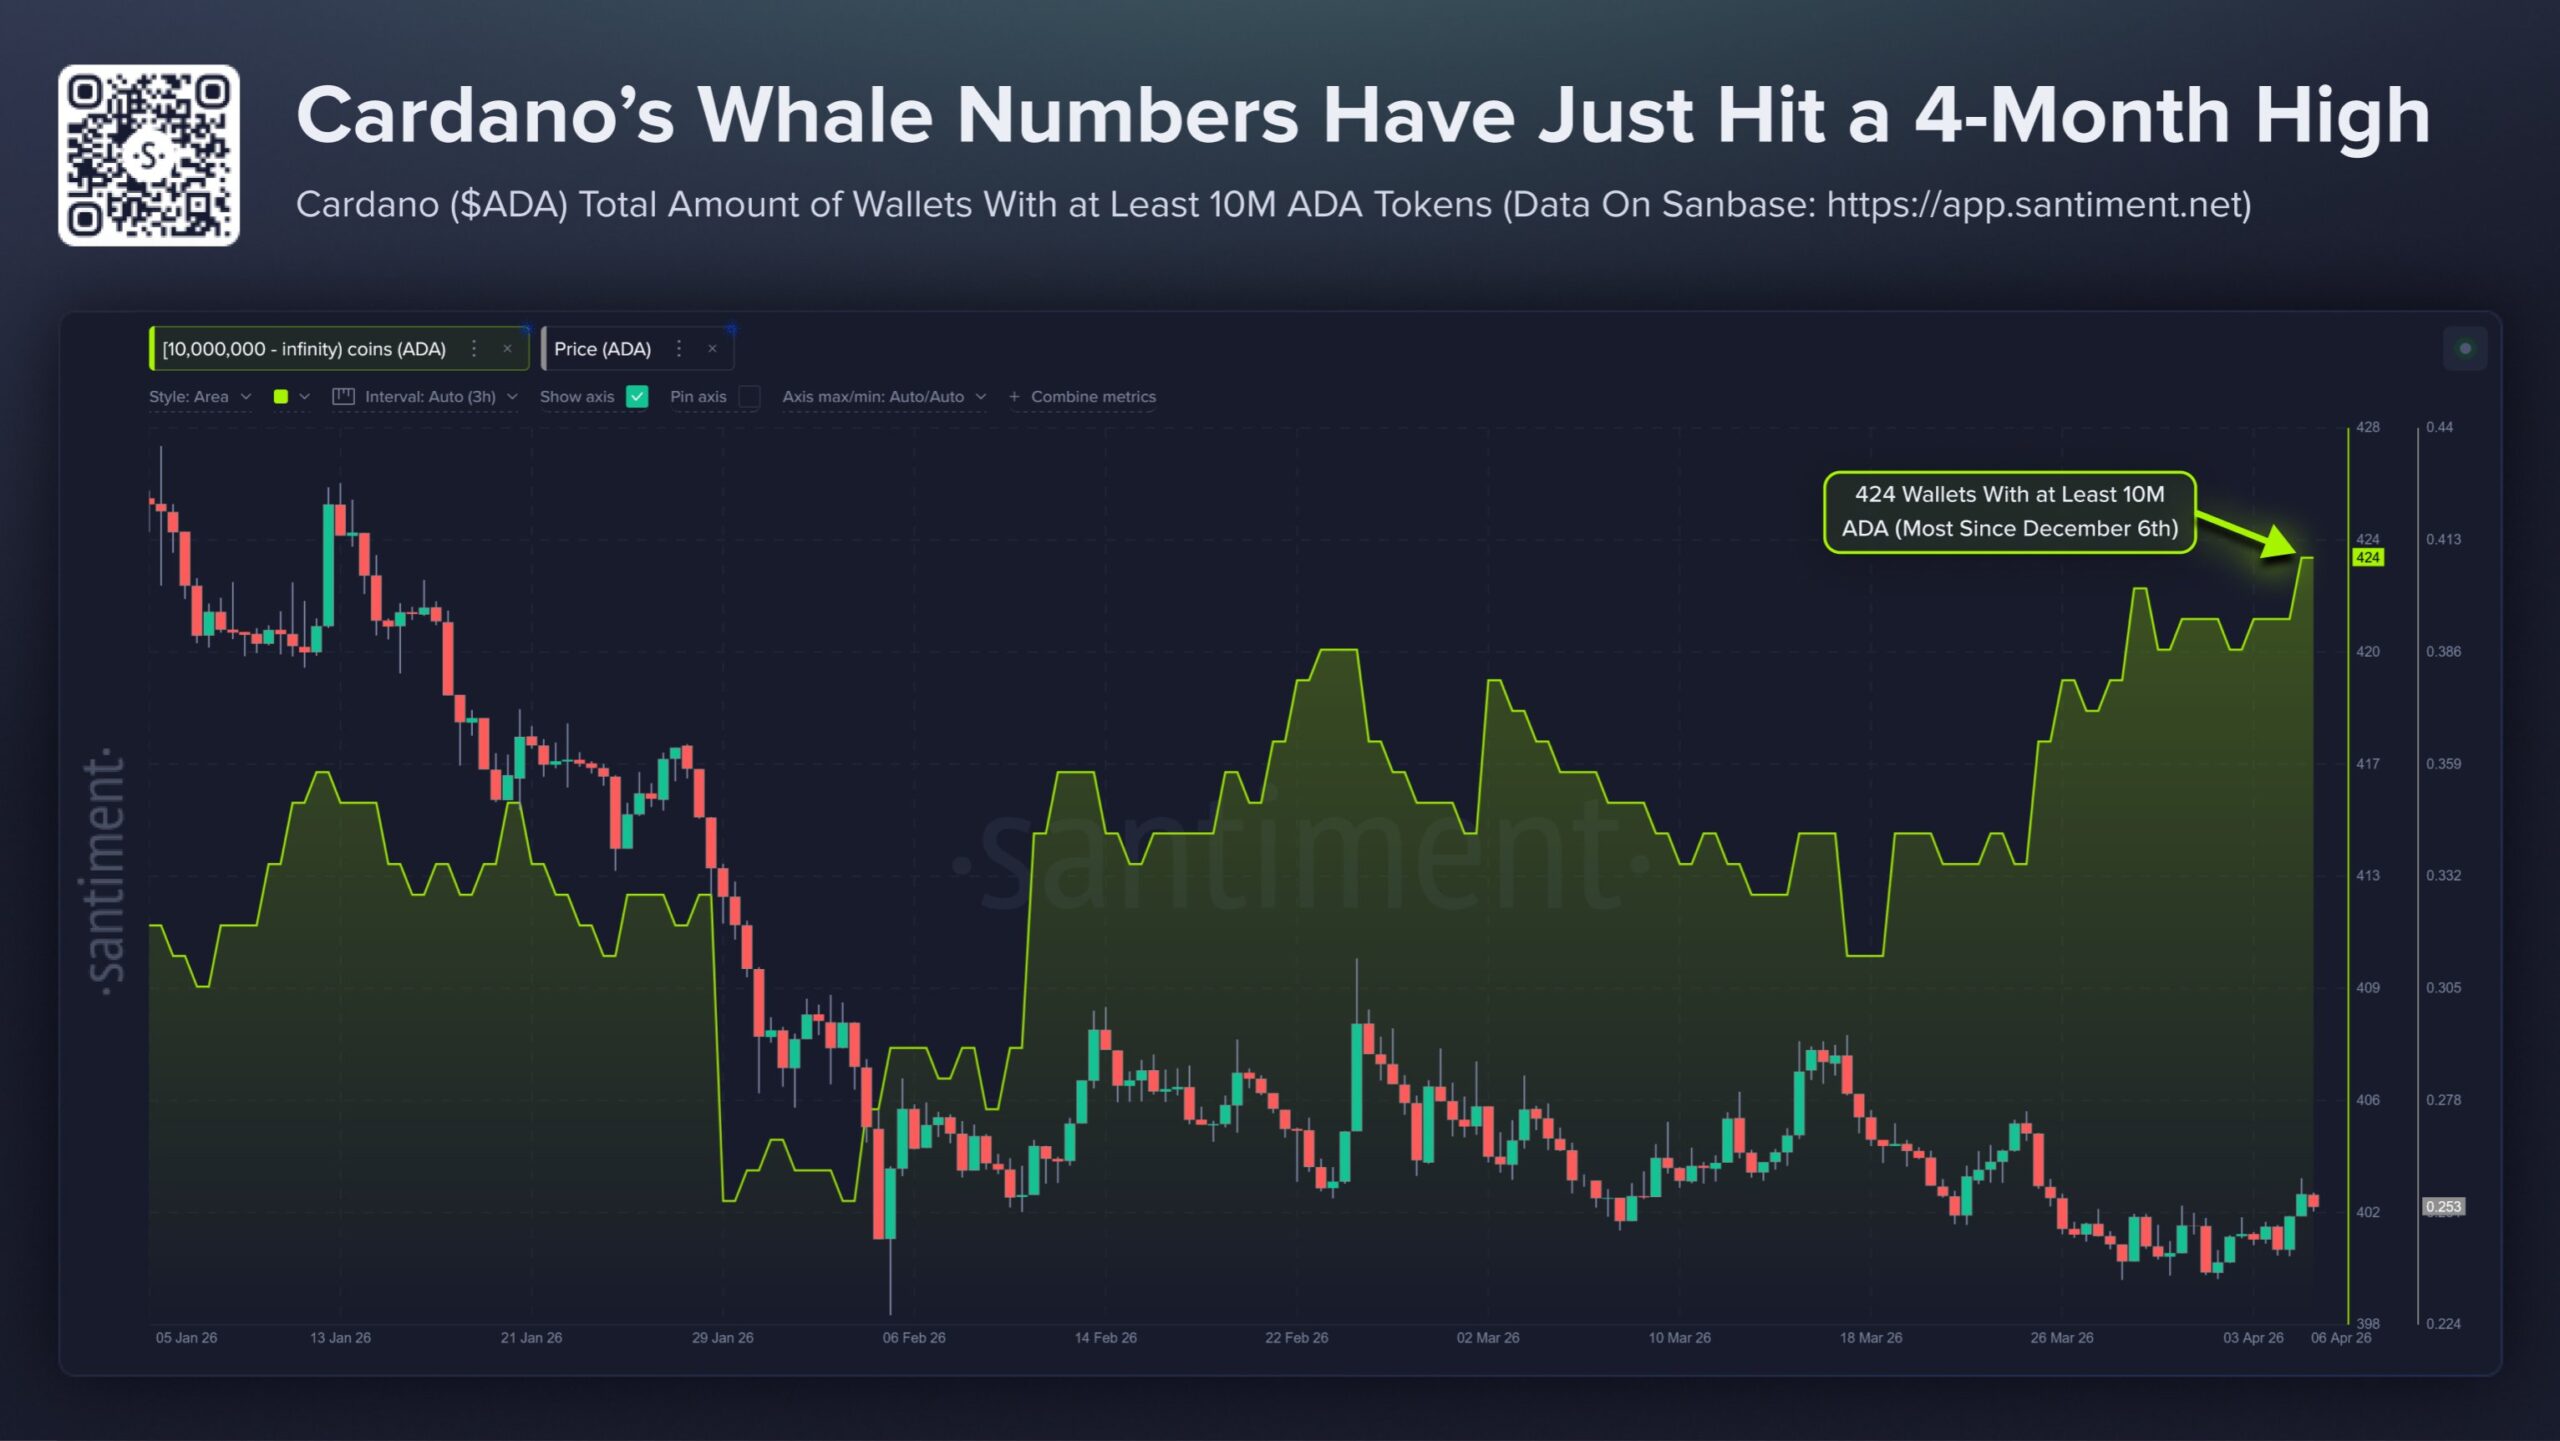
- Cardano whale wallets (10M+ ADA) hit a 4-month high of 424, signaling strong smart money accumulation despite price weakness.
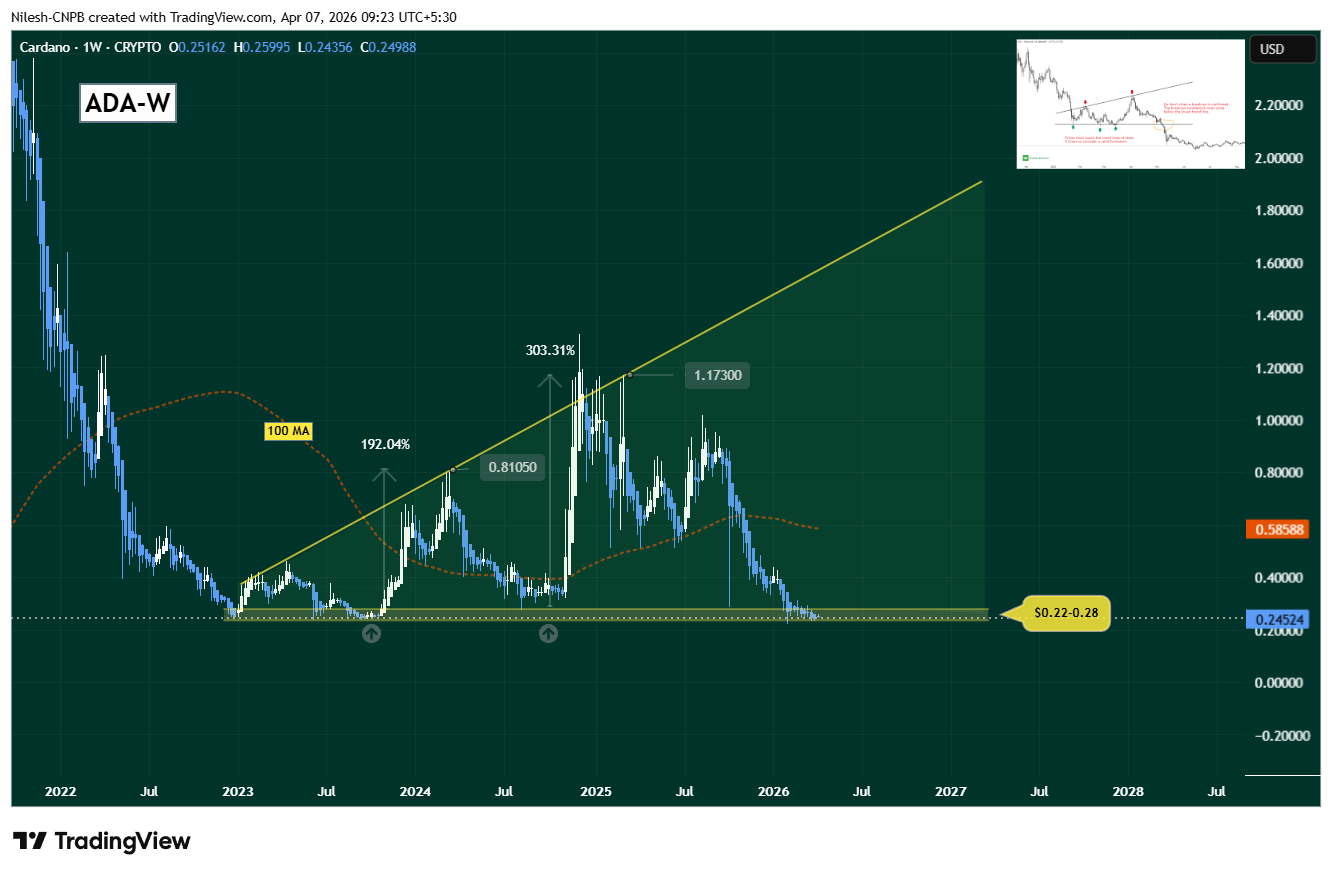
- ADA is trading near $0.245, sitting on a major $0.22–$0.28 support zone that has historically acted as a strong base.
- Bullish trigger: Reclaim of the 100 MA ($0.588) could open the path toward $1.01.
- Risk zone: A breakdown below $0.22 may send ADA toward $0.15–$0.17 support.
Cardano is at one of the most technically and fundamentally significant inflection points in its recent history — with smart money quietly accumulating at a 4-month high even as price tests a multi-year support zone that has defined ADA’s entire recovery structure since 2023. The next few weekly closes will determine whether this is a major accumulation floor before a sustained recovery — or the beginning of a deeper breakdown toward levels not seen since the depths of the 2022 bear market.
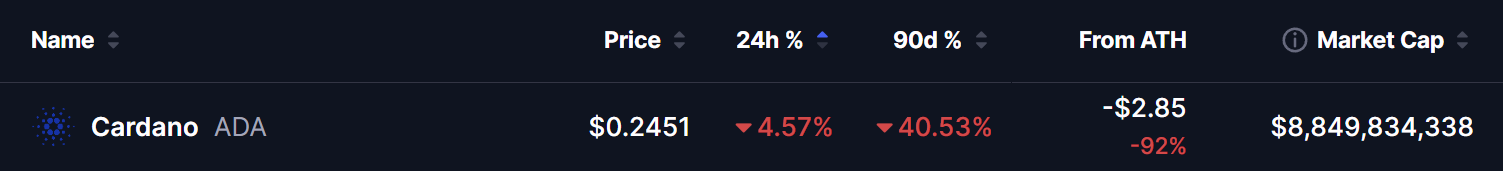
As of April 7, 2026, ADA is trading at $0.2451, down 4.57% in the past 24 hours and 40.53% over the past 90 days, with a market capitalization of approximately $8.85 billion — sitting approximately 92% below its all-time high.
Whale Accumulation — Smart Money Hits 4-Month High
While retail sentiment remains cautious and price continues to drift lower, the on-chain data is telling a dramatically different story — one that has historically preceded significant Cardano price recoveries.
According to Santiment data shared on April 6, 2026:
“Cardano’s number of wallets holding at least 10M $ADA tokens has ballooned to a 4-month high of 424 — a +5.2% rise in 9 weeks. Even though it has not decoupled from other altcoins yet in 2026, its market value is +11% since it bottomed out back on February 5th.”
What This Signal Means:
424 wallets holding 10M+ ADA represents the highest concentration of large-wallet accumulation since December 2025 — and the +5.2% increase in just 9 weeks is particularly significant because it has occurred entirely during a period of sustained price weakness.
This is the classic smart money divergence pattern — large capital participants increasing their positions while retail sentiment is negative and price is declining. The logic behind this behavior is straightforward: wallets holding 10 million or more ADA are not retail participants making small purchases. These are institutional-scale holders who are deliberately building positions at what they assess to be attractive long-term entry levels.
Technical Analysis — ADA Testing Critical Support
On the weekly chart, ADA has been developing a Right-Angled Ascending Broadening Formation since the 2023 lows — a long-term structure that now places price at its most critical support level since the pattern began.
What Is This Pattern?
The Right-Angled Ascending Broadening Formation is defined by two specific trendlines — a flat horizontal support base and an upward-sloping upper resistance trendline. Unlike symmetrical broadening formations, the flat lower boundary makes the support level precisely identifiable — which is what makes the current retest so technically significant.
The pattern reflects increasing volatility and wider price swings over time — each successive rally has reached higher levels along the upper trendline, while each correction has returned to the same horizontal support base. This behavior is visible in the two major ADA rallies marked on the chart — +192% and +303% — both of which launched from the same $0.22–$0.28 horizontal support that ADA is testing right now.
Important caveat: In classical technical analysis, this pattern is often classified as a bearish reversal structure when it appears after a sustained uptrend — because the widening range signals increasing volatility and potentially weakening buyer control over time. This is why the current test of the horizontal base is genuinely high-stakes — it is either a major accumulation floor or the beginning of a pattern breakdown.
Current Position — Testing the Horizontal Base:
ADA at $0.2451 is sitting directly on the $0.22–$0.28 horizontal support zone — the flat lower boundary of the broadening formation that has held on every previous test since 2023. The proximity of current price to this zone makes it the single most important level on the weekly chart.
What’s Next for ADA?
Bullish Scenario
- $0.22–$0.28 horizontal support holds on a weekly closing basis — the Right-Angled Ascending Broadening Formation base remains intact
- Whale accumulation continues — 424 large wallets building positions provides a structural demand floor that absorbs selling pressure at the support zone
- 100 MA at $0.588 reclaimed — medium-term momentum shift confirmed, pattern bullish bias restored
- $1.01 target activates — consistent with the upper trendline projection of the broadening formation and the historical magnitude of previous launches from this support
- Broader altcoin market recovery — a Bitcoin-led risk-on shift provides the macro tailwind needed to lift ADA above key resistance levels
Bearish Scenario
- Weekly close below $0.22 — horizontal support breaks and the broadening formation is confirmed as a bearish reversal pattern
- Whale accumulation proves insufficient to absorb the selling pressure at the support zone
- Pattern breakdown activates the $0.15–$0.17 support target — a further ~35% decline from current price levels
- Broader altcoin weakness continues — Bitcoin dominance remains elevated and risk-off sentiment prevents any sustained ADA recovery regardless of the specific technical structure
Frequently Asked Questions
Why are Cardano whale numbers at a 4-month high significant?
Wallets holding 10 million or more ADA represent institutional-scale participants — not retail traders. When this cohort increases its holdings by 5.2% in just 9 weeks during a period of sustained price decline, it signals deliberate accumulation at what large capital participants assess as attractive entry levels. Historically this type of smart money divergence in Cardano has preceded significant price recoveries.
What is the Right-Angled Ascending Broadening Formation and what does it mean for ADA?
This pattern is defined by a flat horizontal support base at $0.22–$0.28 and an upward-sloping upper resistance trendline. It reflects increasing volatility over time — with each rally reaching higher levels and each correction returning to the same horizontal support. While it can be a bearish reversal pattern in classical analysis, the $0.22–$0.28 support has previously launched ADA rallies of +192% and +303% — making the current test of this zone genuinely high-stakes in both directions.
What are ADA’s key price targets from the current setup?
Bullish: A hold above $0.22–$0.28, reclaim of the 100 MA at $0.588, and continuation toward $1.01 as the primary target. Bearish: A weekly close below $0.22 confirms the pattern breakdown and targets $0.15–$0.17 as the next meaningful support.
What would confirm the bullish scenario for ADA?
Two sequential confirmations are needed: first, weekly closes consistently above the $0.22–$0.28 horizontal support — confirming the base is holding. Second, a sustained reclaim of the 100 MA at $0.588 — signaling medium-term momentum has shifted decisively in favor of buyers and opening the path toward the $1.01 target.
What invalidates the bullish ADA setup?
A confirmed weekly close below $0.22 — the lower boundary of the horizontal support zone — invalidates the broadening formation’s bullish base and confirms the pattern is resolving as a bearish reversal structure. In this scenario, the next meaningful support is the $0.15–$0.17 zone.

The opinions and market insights shared on CoinsProbe represent the views of individual authors based on prevailing market conditions at the time of publication. Cryptocurrency investments carry significant risk and volatility. Readers are encouraged to conduct their own research and seek professional financial advice before making investment decisions. CoinsProbe and its contributors do not accept responsibility for financial losses or decisions made based on published content.
CoinsProbe may publish sponsored articles, affiliate links, or promotional collaborations. All sponsored material is clearly labeled to maintain transparency with our audience. Our editorial decisions remain fully independent, and advertising partnerships do not influence reviews, rankings, or published opinions.
Since 2023, CoinsProbe has delivered reliable insights on cryptocurrency, blockchain, and digital assets. Our content is created by experienced researchers and analysts who follow strict editorial standards focused on accuracy, transparency, and credibility. Every article is carefully reviewed and verified using trusted sources and current market data. We provide unbiased analysis and timely updates covering everything from emerging crypto projects to major industry developments.