
- Cardano (ADA) is trading at $0.2689, down 27.82% over the past 90 days and 91% below its all-time high of $3.09.
- The TD Sequential indicator has printed a weekly "9 count" on ADA's chart — historically signaling exhaustion of the prevailing downtrend.
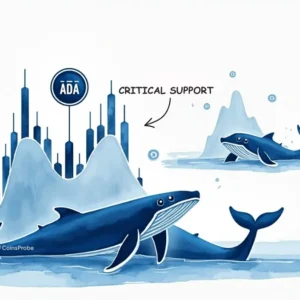
- ADA is retesting the $0.23–$0.28 support zone — the same level that triggered a 192% rally in 2023 and a 303% rally in 2024.
- The Right-Angled Ascending Broadening Wedge pattern on the weekly chart projects a potential move toward $1.90+ by 2027 if support holds.
- Validation level: ADA must hold $0.23 on a weekly close for the bullish setup to remain intact.
Cardano (ADA) is currently trading at $0.2689 as of March 20, 2026, with a market capitalization of approximately $9.7 billion — keeping it among the top 10 largest cryptocurrencies by market cap despite a prolonged correction.
The numbers paint a challenging picture over recent months. ADA has declined 27.82% over the past 90 days and sits 91% below its all-time high of $3.09, reached during the peak of the 2021 bull cycle. Over the past six months, the token has shed the majority of gains accumulated during the 2024–2025 rally that took it from $0.30 to a local high near $1.32.
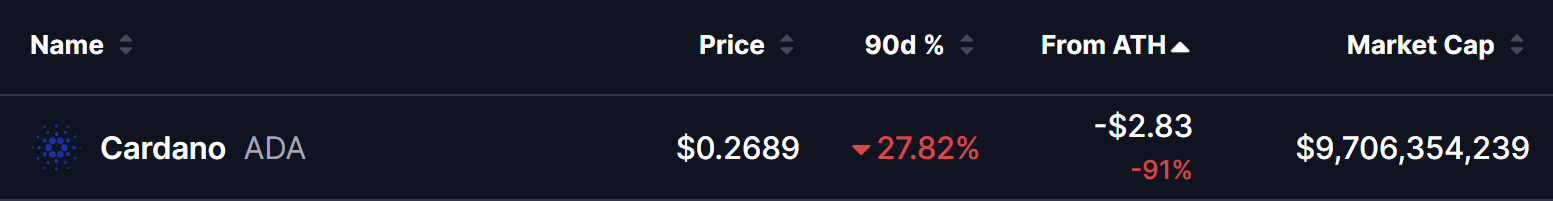
Despite the steep drawdown, ADA’s current price level is not unfamiliar territory. The $0.26–$0.28 range represents one of the most significant support zones in Cardano’s entire price history — and it is now being tested for the third time since 2022.
TD Sequential Analysis — Weekly Exhaustion Signal
Prominent crypto analyst Ali Charts (@alicharts) has flagged a significant technical development on Cardano’s weekly chart. According to his analysis, the TD Sequential indicator has printed a “9 count” — a signal that marks the potential exhaustion of the current downtrend.
The TD Sequential is a time-based indicator developed by market analyst Tom DeMark. It counts nine consecutive candles closing lower than the candle four periods prior, and when the count completes at “9,” it signals that the selling trend may be running out of momentum. Historically, this setup anticipates 1 to 4 weeks of price expansion in the opposite direction.
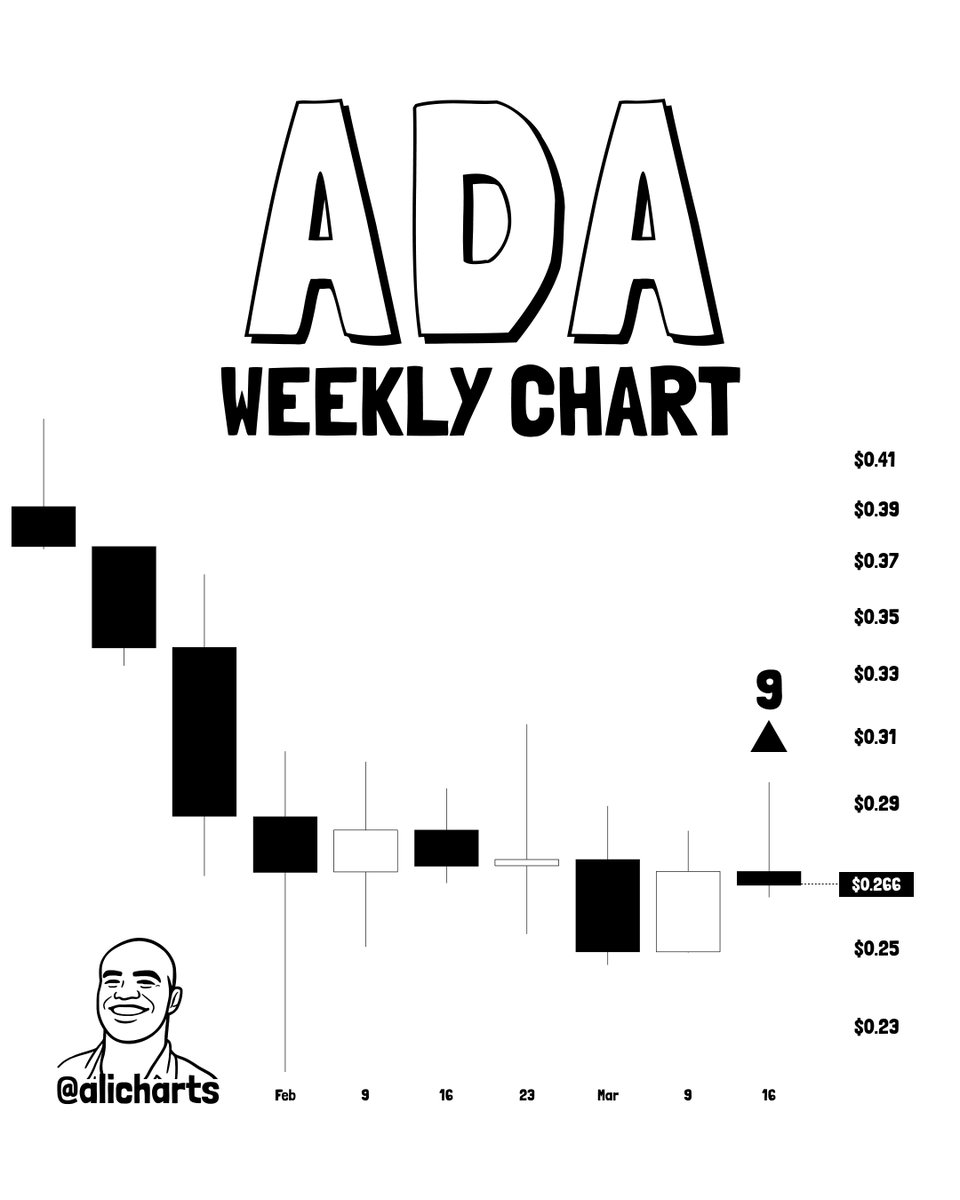
On ADA’s weekly chart, this count has completed precisely as the token sits at multi-year support — creating a confluence of time-based and price-based signals simultaneously.
The setup breakdown:
- Validation: ADA must hold the $0.23 support level on a weekly close. As long as this level holds, the exhaustion signal remains active and valid.
- First target: A successful defense of $0.23 puts $0.32 in focus as the initial recovery resistance level.
- Second target: If momentum builds above $0.32, the next area of interest sits at $0.37 — the upper boundary of the recent consolidation range.
- Invalidation: A weekly close below $0.23 cancels the TD Sequential setup entirely and would signal that the downtrend has further to run.
It is worth noting that the TD Sequential is a probability-based tool, not a guarantee of reversal. The signal increases the likelihood of a bounce but must be confirmed by actual price action holding above the $0.23 level on a weekly closing basis.
Historic Support — A Zone That Has Defined ADA’s Market Structure
What makes the current setup particularly compelling is the historical significance of the price zone ADA is now testing.
The $0.23–$0.28 support band has acted as a major demand zone across multiple market cycles:
First test — Early 2023: After the collapse of FTX sent crypto markets into a deep bear phase, ADA bottomed in the $0.25 zone in early 2023. Buyers stepped in aggressively at this level, absorbing all selling pressure. The result was a 192% rally that took ADA from $0.25 to $0.73 over the following months.
Second test — Mid 2023: ADA returned to the same $0.25 zone in mid-2023 during a broader market pullback. Once again the level held. This second successful defense preceded a 303% rally that ultimately carried ADA to $1.32 by late 2024.
Third test — March 2026: ADA is now revisiting this same $0.23–$0.28 zone for the third time. At $0.2689, the token is sitting directly within the support band that has defined its cycle lows for the past four years.
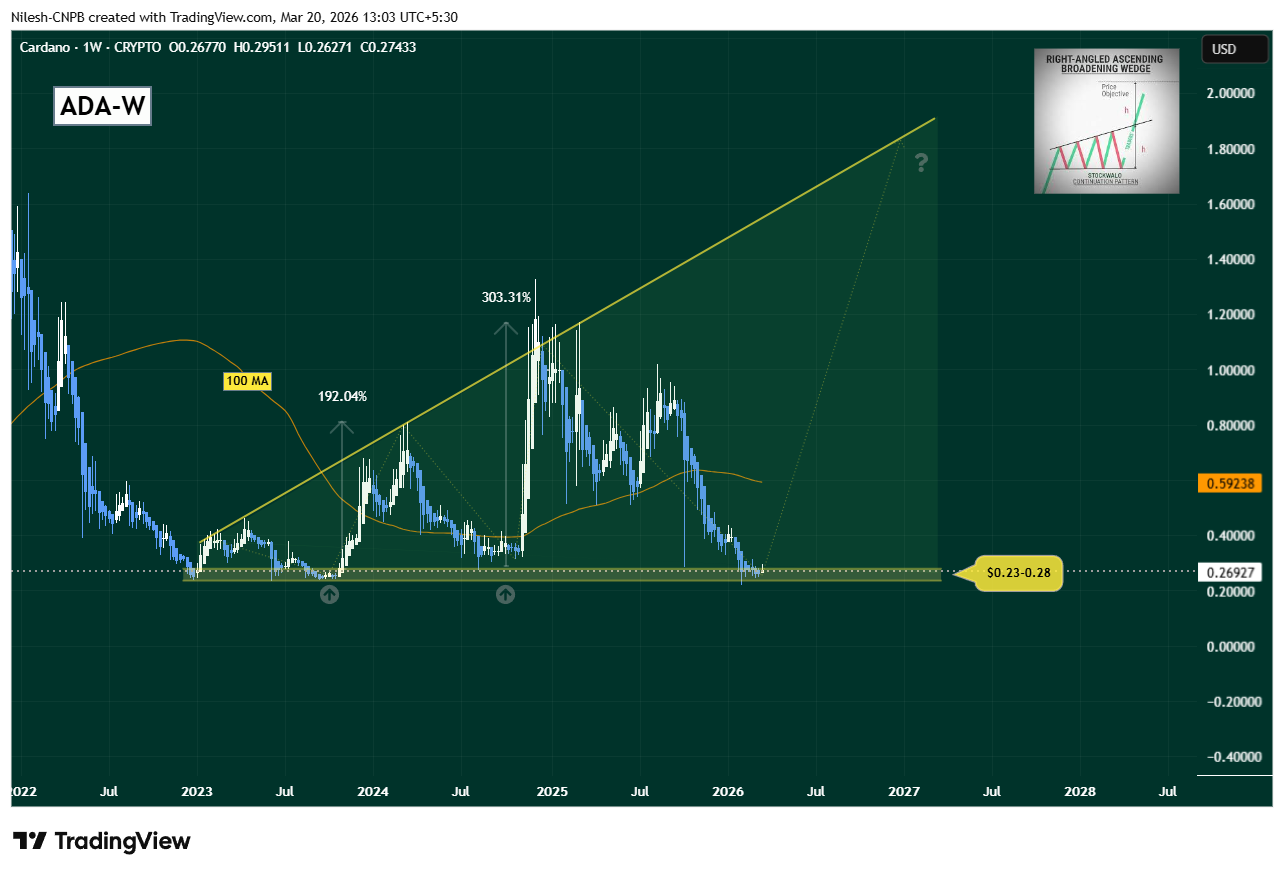
The weekly chart also shows a Right-Angled Ascending Broadening Wedge pattern forming since 2022 — a continuation pattern characterized by a flat lower support line and a rising upper trendline. Each successive rally from the support zone has reached a higher high, consistent with the broadening wedge structure. If the pattern continues to play out, the upper trendline projects a potential target of $1.90+ by mid-2027.
The 100-week moving average, currently sitting at $0.5923, has historically acted as a magnet during ADA recovery phases. Both the 2023 and 2024 rallies from this support zone eventually reclaimed the 100 MA before continuing higher.
What’s Next for ADA?
Cardano now sits at a critical decision point — one that will likely define its trajectory for the remainder of 2026.
Bullish Scenario
For the bullish case to play out, ADA needs to accomplish two things in sequence:
Step 1 — Hold $0.23 on a weekly close. This is the non-negotiable confirmation level. A weekly candle closing above $0.23 keeps the TD Sequential exhaustion signal valid and confirms that buyers are defending the historic support zone.
Step 2 — Reclaim the 100-week moving average at $0.5923. A recovery back above the 100 MA would represent a major structural shift — flipping the medium-term trend from bearish to neutral/bullish. Historically, each time ADA reclaimed the 100 MA from below, it marked the beginning of a sustained rally phase. Achieving this would put $0.32 and $0.37 in focus as intermediate targets, with the broadening wedge upper trendline near $1.90 as the longer-term objective.
Bearish Scenario
If ADA fails to hold the current support zone, the picture changes significantly.
A weekly close below $0.23 would invalidate both the TD Sequential setup and the historic support thesis. This would signal that the demand zone — which held for four years across two complete market cycles — has finally broken down. In this scenario, the next meaningful support levels would be found significantly lower, potentially in the $0.14–$0.18 range based on prior consolidation zones visible on the long-term chart.
For now, all eyes remain on the weekly close. Six months of declining prices have brought ADA back to the exact level where buyers have historically stepped in with conviction — and a time-based exhaustion signal is now adding weight to that argument.
Frequently Asked Questions
What is the TD Sequential indicator?
The TD Sequential is a time-based technical indicator developed by market analyst Tom DeMark. It counts sequential candles closing lower (or higher) than the candle four periods prior. When the count reaches “9,” it signals that the current trend may be exhausted and a reversal or pause is likely. The signal is particularly significant when it aligns with key price support or resistance zones.
Why is the $0.23–$0.28 zone so important for Cardano?
This zone has acted as the cycle low for ADA across multiple market phases since 2022. It served as the base for two major rallies — a 192% move in 2023 and a 303% move into 2024. The repeated defense of this level by buyers over four years makes it one of the most significant support zones in ADA’s price history.
What is the Right-Angled Ascending Broadening Wedge pattern?
It is a continuation pattern characterized by a flat horizontal lower support line and a rising upper trendline — creating a broadening or expanding shape on the chart. Each rally from the lower support reaches a higher high, while the lows remain relatively stable. The pattern projects a price objective measured by the height of the wedge added to the breakout point.
What would confirm that ADA has bottomed?
Two confirmations are needed: first, a weekly candle closing above the $0.23 support level, validating the TD Sequential exhaustion signal. Second, a recovery and sustained hold above the 100-week moving average at $0.5923, which would signal a structural trend reversal from bearish to bullish.
What invalidates the bullish setup for ADA?
A weekly close below $0.23 would invalidate both the TD Sequential signal and the historic support thesis. This would suggest the four-year support zone has broken down and that further downside toward $0.14–$0.18 is possible.

The opinions and market insights shared on CoinsProbe represent the views of individual authors based on prevailing market conditions at the time of publication. Cryptocurrency investments carry significant risk and volatility. Readers are encouraged to conduct their own research and seek professional financial advice before making investment decisions. CoinsProbe and its contributors do not accept responsibility for financial losses or decisions made based on published content.
CoinsProbe may publish sponsored articles, affiliate links, or promotional collaborations. All sponsored material is clearly labeled to maintain transparency with our audience. Our editorial decisions remain fully independent, and advertising partnerships do not influence reviews, rankings, or published opinions.
Since 2023, CoinsProbe has delivered reliable insights on cryptocurrency, blockchain, and digital assets. Our content is created by experienced researchers and analysts who follow strict editorial standards focused on accuracy, transparency, and credibility. Every article is carefully reviewed and verified using trusted sources and current market data. We provide unbiased analysis and timely updates covering everything from emerging crypto projects to major industry developments.