Date: Mon, July 07, 2025 | 05:38 AM GMT
As Q3 begins, the cryptocurrency market is extending its momentum from Q2, with Ethereum (ETH) trading near $2,575 after gaining over 63% in the past 90 days. In the memecoin space, Solana-based tokens continue to attract attention — and Book of Meme (BOME) is now flashing a chart pattern that could hint at a powerful upside move.
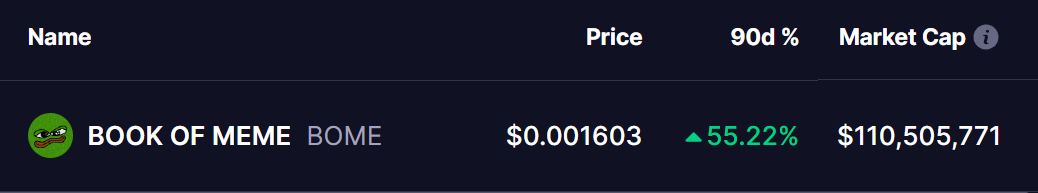
BOME has already climbed over 55% in the past 90 days. But beyond the recent gains, what’s catching more attention is the emerging fractal pattern that BOME is forming — one that closely mirrors BONK’s recent breakout structure.
BOME Mirrors BONK’s Breakout Structure
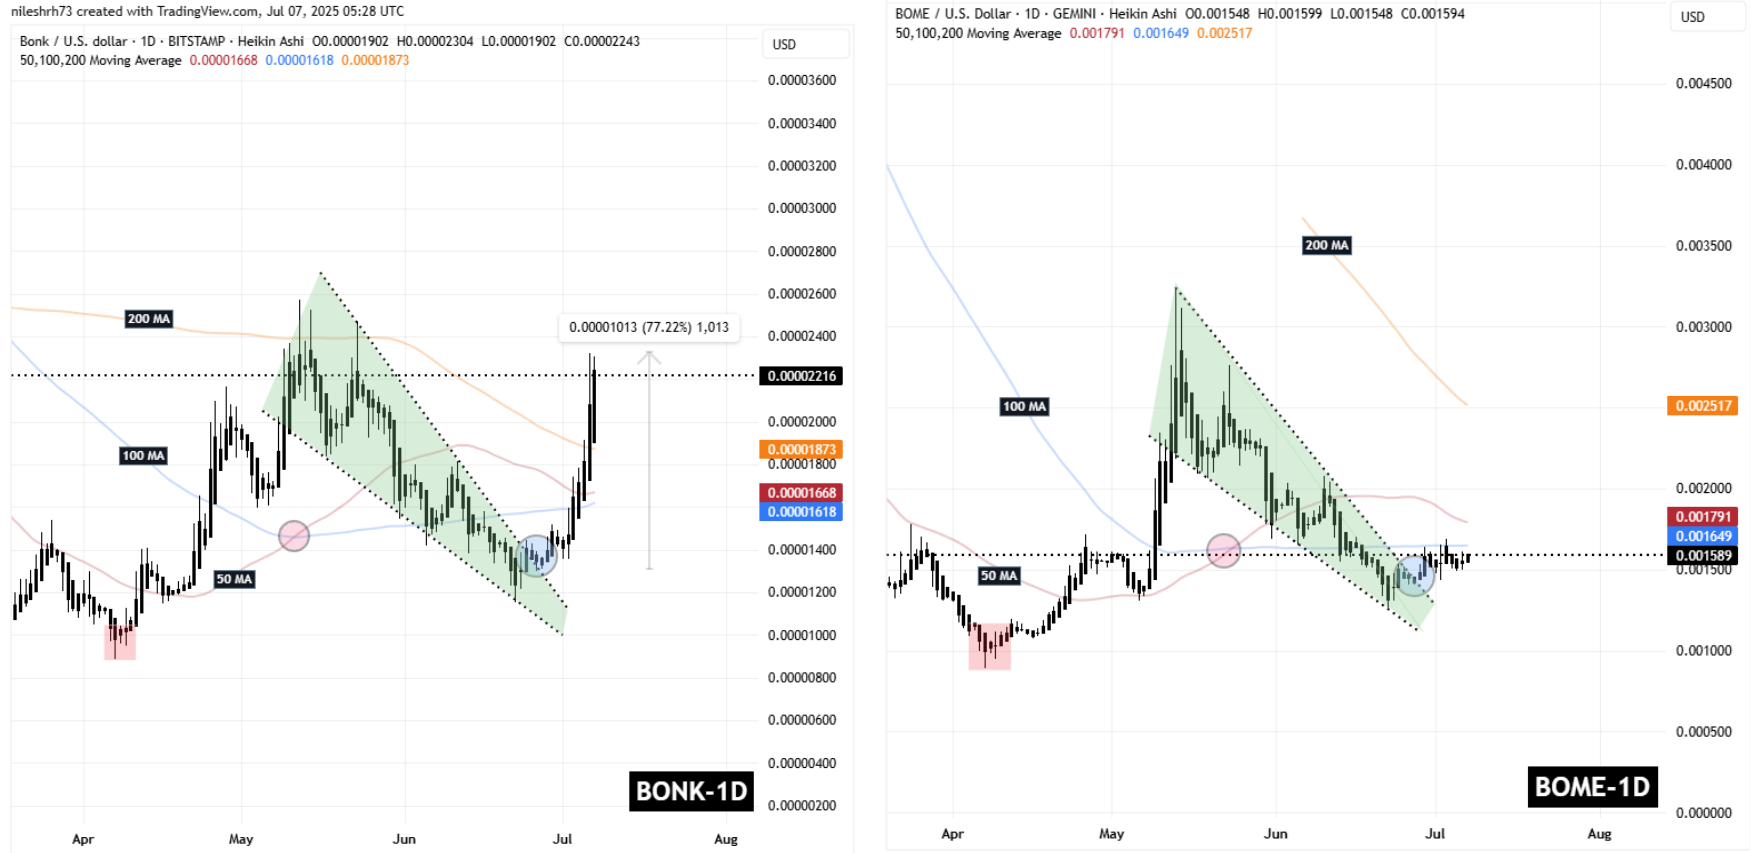
On the daily chart, BONK recently completed a textbook falling wedge pattern — a classic bullish reversal setup. The breakout was confirmed when BONK decisively moved above the wedge structure and flipped its 50-day, 100-day, and 200-day moving averages. That move kicked off a strong 77% rally, with the price rising from around $0.00001312 to nearly $0.00002319.
Now, BOME appears to be following a nearly identical setup.
BOME has also broken out of a falling wedge pattern and is currently consolidating just beneath its 50-day and 100-day moving averages, near the $0.001791 resistance zone. This zone is key — it’s the same kind of consolidation that BONK saw before its explosive breakout.
The similarities between both structures are striking. If this fractal continues to play out, BOME may be poised for a major move higher.
What’s Next for BOME?
For BOME to confirm this bullish fractal, it must decisively close above the 50-day moving average (currently near $0.001791) with strong volume. A breakout above this level would likely clear the path toward its 200-day MA at $0.002517 — a potential 57% upside from current prices.
However, confirmation is crucial.
Until BOME breaks and holds above its immediate resistance zone, the setup remains unconfirmed, and the risk of sideways consolidation remains. Still, the fractal resemblance to BONK gives bulls a reason to watch closely.
Disclaimer: This article is for informational purposes only and not financial advice. Always conduct your own research before investing in cryptocurrencies.

The opinions and market insights shared on CoinsProbe represent the views of individual authors based on prevailing market conditions at the time of publication. Cryptocurrency investments carry significant risk and volatility. Readers are encouraged to conduct their own research and seek professional financial advice before making investment decisions. CoinsProbe and its contributors do not accept responsibility for financial losses or decisions made based on published content.
CoinsProbe may publish sponsored articles, affiliate links, or promotional collaborations. All sponsored material is clearly labeled to maintain transparency with our audience. Our editorial decisions remain fully independent, and advertising partnerships do not influence reviews, rankings, or published opinions.
Since 2023, CoinsProbe has delivered reliable insights on cryptocurrency, blockchain, and digital assets. Our content is created by experienced researchers and analysts who follow strict editorial standards focused on accuracy, transparency, and credibility. Every article is carefully reviewed and verified using trusted sources and current market data. We provide unbiased analysis and timely updates covering everything from emerging crypto projects to major industry developments.