Date: Thu, Nov 14, 2024, 11:43 AM GMT
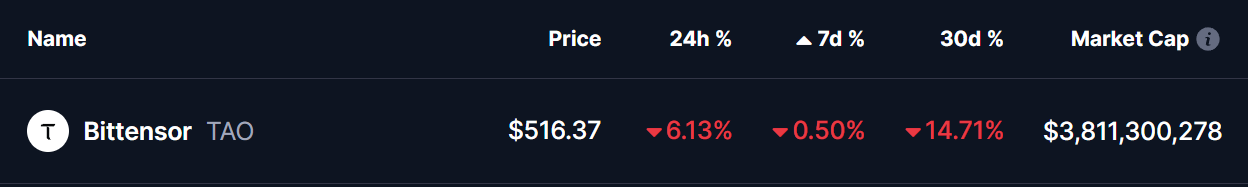
In the cryptocurrency market, Bitcoin’s (BTC) strong upward rally and increasing dominance have impacted altcoin performance, including Bittensor (TAO). Currently, TAO has seen a significant correction, down by 6% on the day, and is trading around $518. Both weekly and monthly returns are in the negative territory as altcoins experience bearish pressure due to rising BTC dominance.
Technical Analysis: Daily and 15-Minute Chart Perspectives
Daily Chart: On the daily timeframe, TAO experienced a robust rally of 50% starting on November 5, reaching a resistance level at $624, where it faced rejection. Since then, the price has retraced by over 15%, and it is now trading within a critical support zone between $527 and $490.

This support area could play a key role in determining whether TAO will consolidate for a potential rebound or experience further downside. Holding above this level could attract buyers looking for a recovery opportunity.
The Relative Strength Index (RSI) is currently near 49, indicating a neutral stance and suggesting that momentum could shift either way based on market conditions. Resistance (R) is clearly observed around the $624 mark, and if TAO maintains support within the current zone, it may eventually test this resistance level again in a recovery attempt.

15-Minute Chart:

On the 15-minute chart, TAO’s price action is forming a descending wedge pattern, which typically signals a potential bullish reversal if a breakout occurs. A breakout from this wedge could drive the price up toward the $624 resistance, initiating a short-term recovery. However, failure to break out could result in further consolidation within the support area. The RSI on this timeframe is currently at 22.66, suggesting an oversold condition and potential for a short-term bounce.
Summary
In summary, Bittensor (TAO) has entered a critical support zone following a significant correction from recent highs. The support level between $527 and $490 on the daily chart could provide a foundation for a recovery, while a breakout from the descending wedge pattern on the 15-minute chart would signal a stronger bullish reversal. The RSI on both timeframes indicates potential for a bounce, but a sustained move above the $624 resistance would be necessary for a full recovery. Traders should watch for a breakout from the wedge for confirmation of a rebound.
Disclaimer: This article is for informational purposes only and not financial advice. Always conduct your own research before investing in cryptocurrencies.

The opinions and market insights shared on CoinsProbe represent the views of individual authors based on prevailing market conditions at the time of publication. Cryptocurrency investments carry significant risk and volatility. Readers are encouraged to conduct their own research and seek professional financial advice before making investment decisions. CoinsProbe and its contributors do not accept responsibility for financial losses or decisions made based on published content.
CoinsProbe may publish sponsored articles, affiliate links, or promotional collaborations. All sponsored material is clearly labeled to maintain transparency with our audience. Our editorial decisions remain fully independent, and advertising partnerships do not influence reviews, rankings, or published opinions.
Since 2023, CoinsProbe has delivered reliable insights on cryptocurrency, blockchain, and digital assets. Our content is created by experienced researchers and analysts who follow strict editorial standards focused on accuracy, transparency, and credibility. Every article is carefully reviewed and verified using trusted sources and current market data. We provide unbiased analysis and timely updates covering everything from emerging crypto projects to major industry developments.