
Date: Sun, May 18, 2025 | 05:20 AM GMT
The cryptocurrency market has mounted a solid comeback in recent weeks, with Ethereum (ETH) continuing to lead the charge. ETH has surged more than 57% in the past month and is now trading below $2,500 after hitting a high of $2,700 — a level not seen since late February. This renewed bullish momentum is lifting sentiment across altcoins, including The Bitget Token (BGB).
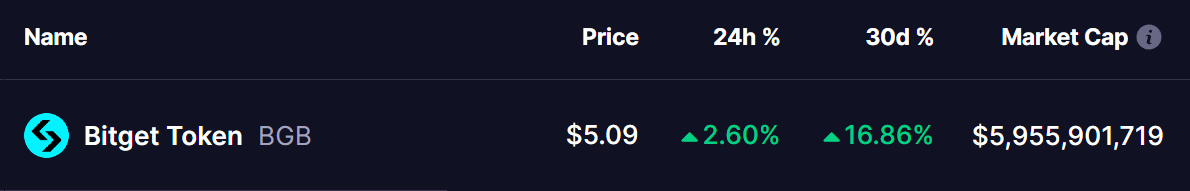
The CEX token is currently showing monthly gains of over 16 percent. More importantly, a well-known harmonic pattern forming on its chart suggests that further upside may be on the horizon.
Harmonic Pattern Signals More Upside
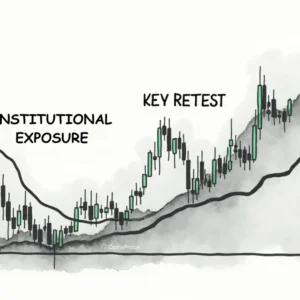
On the daily timeframe, BGB is forming a Bearish Crab harmonic pattern — a technical setup that identifies high-probability reversal zones once the final leg, known as CD, completes. Until that point, the pattern typically drives prices upward with strong bullish momentum.
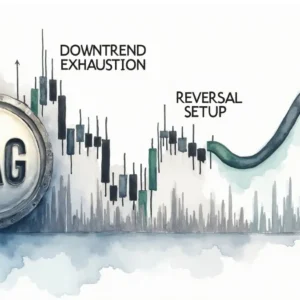
The pattern began when BGB was rejected near $5.15 on March 27, which marked the X point. From there, the price declined nearly 27 percent, bottoming out at approximately $3.71 on April 7, forming the A point.
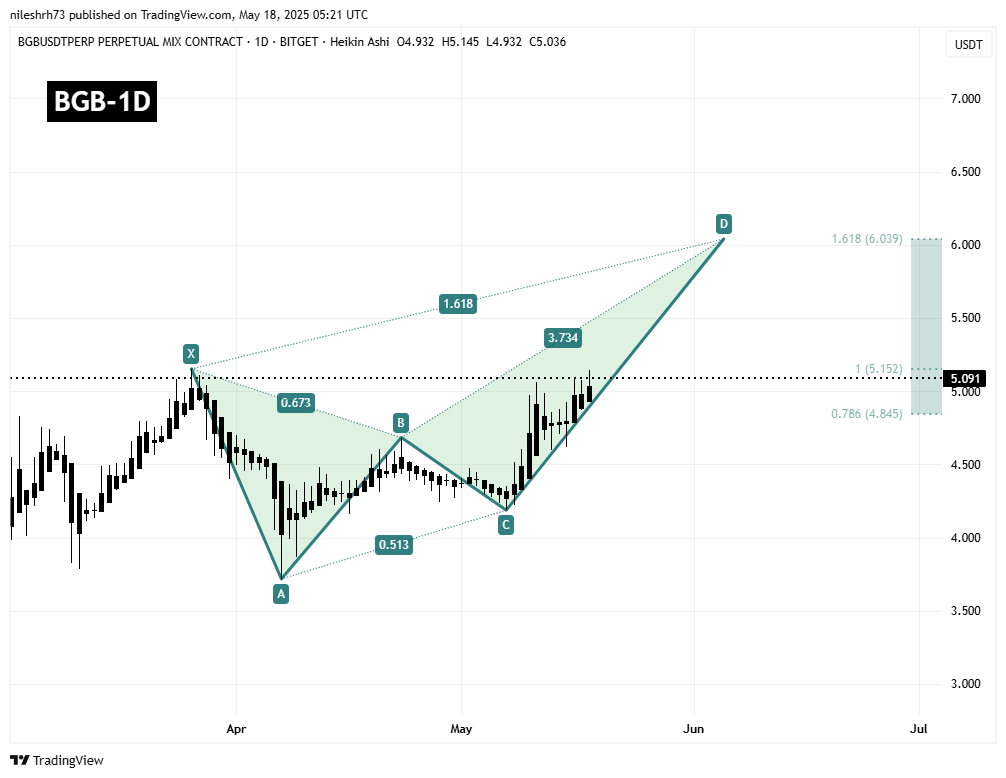
Following this, the AB leg retraced around 67.3% of the XA leg. The BC leg then pulled back roughly 51.3% of AB, which fits well within the ideal Fibonacci boundaries of a Bearish Crab structure, stabilizing near the $4.18 C level. This stabilization marked the return of bullish pressure.
Now, the CD leg is currently in play and moving strongly to the upside. According to the harmonic structure, the projected target for point D is around $6.03, aligning with the 1.618 Fibonacci extension of the XA leg. This zone is often a magnet for bullish price action and traditionally marks both the pattern’s completion and a possible reversal area.
What’s Next for BGB?
If the harmonic pattern continues to play out as expected, BGB could climb to as high as $6.03, representing an approximate 18% upside from its current level near $5.09.
Meanwhile, support is currently found near the 0.786 Fibonacci retracement level at $4.84, which is helping maintain bullish sentiment. The $5.15 zone, which previously acted as resistance at point X, may serve as a short-term hurdle before the price attempts to reach the D target.
However, traders should keep an eye on the broader crypto market. Any significant shift in Ethereum’s momentum or overall market sentiment could influence whether this pattern completes successfully — or fails prematurely.
Disclaimer: This article is for informational purposes only and not financial advice. Always conduct your own research before investing in cryptocurrencies.

The opinions and market insights shared on CoinsProbe represent the views of individual authors based on prevailing market conditions at the time of publication. Cryptocurrency investments carry significant risk and volatility. Readers are encouraged to conduct their own research and seek professional financial advice before making investment decisions. CoinsProbe and its contributors do not accept responsibility for financial losses or decisions made based on published content.
CoinsProbe may publish sponsored articles, affiliate links, or promotional collaborations. All sponsored material is clearly labeled to maintain transparency with our audience. Our editorial decisions remain fully independent, and advertising partnerships do not influence reviews, rankings, or published opinions.
Since 2023, CoinsProbe has delivered reliable insights on cryptocurrency, blockchain, and digital assets. Our content is created by experienced researchers and analysts who follow strict editorial standards focused on accuracy, transparency, and credibility. Every article is carefully reviewed and verified using trusted sources and current market data. We provide unbiased analysis and timely updates covering everything from emerging crypto projects to major industry developments.