
Date: Sun, May 11, 2025 | 05:10 AM GMT
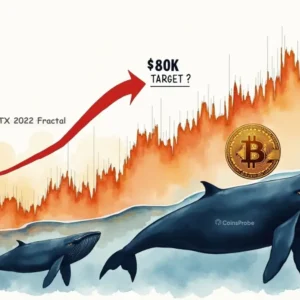
The cryptocurrency market is heating up, with Bitcoin (BTC) smashing through the $104K level and Ethereum (ETH) rallying more than 66% in the last 30 days to hover just under $2,550 — its highest point in recent months. This momentum is spilling over into altcoins, including Bitget Token (BGB).
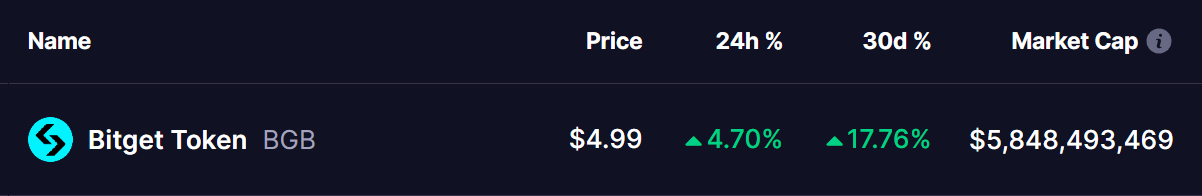
BGB, the native token of the Bitget exchange, is showing strength with over 17% gains this month and is currently trading near $5.0. The daily chart paints a clear picture — BGB is nearing the apex of a long-forming symmetrical triangle pattern that could soon explode with volatility.
Symmetrical Triangle in Play
BGB’s price has been consolidating within a symmetrical triangle since late 2024. In December, the token reached a high of $8.54 before getting rejected sharply, tumbling over 56% to hit a key support zone around $3.72 by early April.
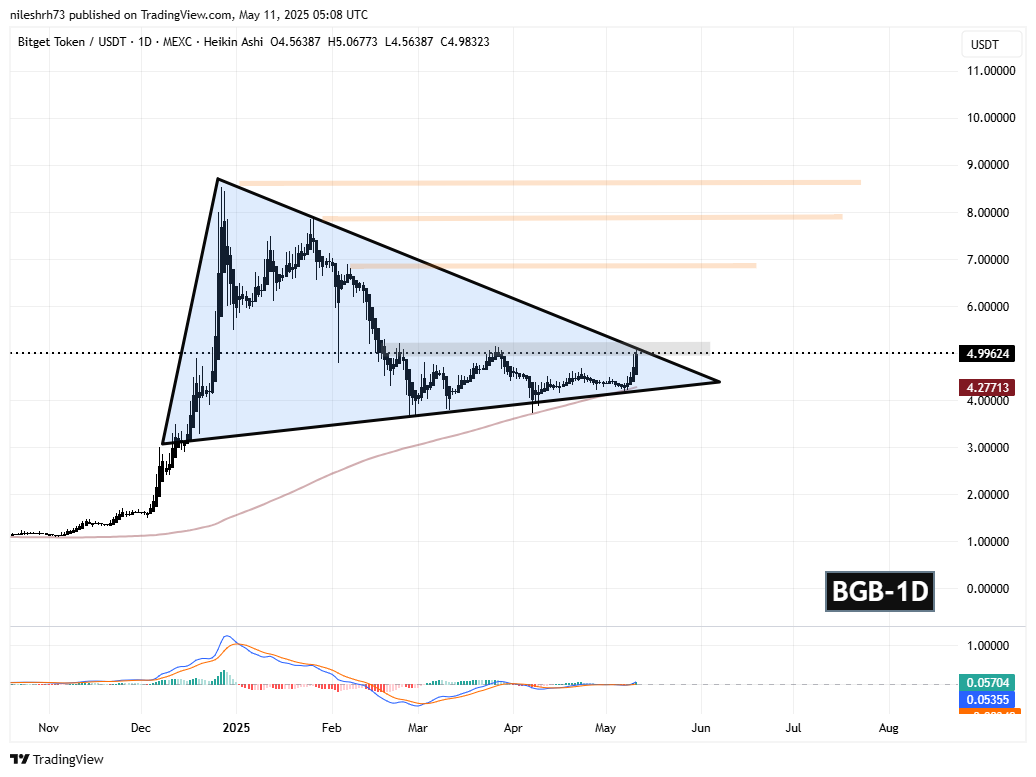
Interestingly, this low coincided with the 200-day moving average, which provided solid support and helped the price bounce back. Since then, BGB has been forming higher lows, and as of today, it’s retesting both the triangle’s upper resistance and a horizontal resistance level near $5.
What’s Next for BGB?
All eyes are now on whether BGB can break out of the symmetrical triangle. A successful breakout above the $5 zone, confirmed by a retest, could set off a sharp rally. Key upside targets include:
- $6.88 – first major resistance post-breakout
- $7.88 – secondary resistance with historical relevance
- $8.54 – the December 2024 high, potentially a longer-term target
A move to $8.54 would mark a nearly 70% gain from current levels.
However, if the breakout fails and BGB gets rejected again, a pullback towards the $4.20–$4.00 area remains possible, especially if the broader market sentiment weakens.
Looking at the MACD indicator below the price chart, a bullish crossover appears to be forming, which historically suggests rising buying pressure. This adds weight to the bullish breakout scenario in the short term.

Disclaimer: This article is for informational purposes only and does not constitute financial advice. Always do your own research before investing in cryptocurrencies.

The opinions and market insights shared on CoinsProbe represent the views of individual authors based on prevailing market conditions at the time of publication. Cryptocurrency investments carry significant risk and volatility. Readers are encouraged to conduct their own research and seek professional financial advice before making investment decisions. CoinsProbe and its contributors do not accept responsibility for financial losses or decisions made based on published content.
CoinsProbe may publish sponsored articles, affiliate links, or promotional collaborations. All sponsored material is clearly labeled to maintain transparency with our audience. Our editorial decisions remain fully independent, and advertising partnerships do not influence reviews, rankings, or published opinions.
Since 2023, CoinsProbe has delivered reliable insights on cryptocurrency, blockchain, and digital assets. Our content is created by experienced researchers and analysts who follow strict editorial standards focused on accuracy, transparency, and credibility. Every article is carefully reviewed and verified using trusted sources and current market data. We provide unbiased analysis and timely updates covering everything from emerging crypto projects to major industry developments.