- Bitcoin LTH Net Position Change is +1.27M BTC over 180 days — positive but decelerating, per @Alphractal (Oct 22, 2026)
- Slowing accumulation pace has historically preceded cycle tops — metric rollover to negative has aligned with every prior bear market
- BTC is trading at $81,765 (-1.15% 24h) with a $1.64T market cap as the signal emerges
- Watch 180-day LTH Net Position Change trajectory: re-acceleration = mid-cycle pause; rollover toward zero = distribution phase beginning
Bitcoin is trading at $81,765 — down 1.15% in the past 24 hours — with a market cap of approximately $1.64 trillion. Beneath the price action, a critical on-chain shift is developing that has historically marked the boundary between accumulation and distribution in Bitcoin’s macro cycle.
On-chain analytics account @Alphractal flagged the dynamic on October 22, 2026: Bitcoin’s Long-Term Holder (LTH) Net Position Change remains positive at +1.27 million BTC over the past 180 days — but the pace of that growth is slowing significantly. The observation is not a buy or sell call. It is a structural warning: a metric that has historically signaled major cycle transitions is entering a zone of deceleration.
What the LTH Net Position Change Actually Measures
The Long-Term Holder Net Position Change tracks the 180-day rolling net accumulation or distribution of coins held by wallets that have not moved their BTC in at least 155 days — the threshold Glassnode and related platforms use to define a long-term holder. A positive reading means LTHs as a cohort are adding to their aggregate holdings. A negative reading means they are net sellers into the market.
Critically, it is not just the sign of the reading that matters — it is the rate of change. When the metric is positive but decelerating, it means LTHs are still accumulating in net terms, but the marginal pace of new coins being locked away is shrinking. Historically, that tapering precedes the phase where LTHs begin distributing into price strength — the exact mechanism that has capped every prior Bitcoin bull market cycle.
The Signal — +1.27M BTC Positive, But Momentum Decelerating
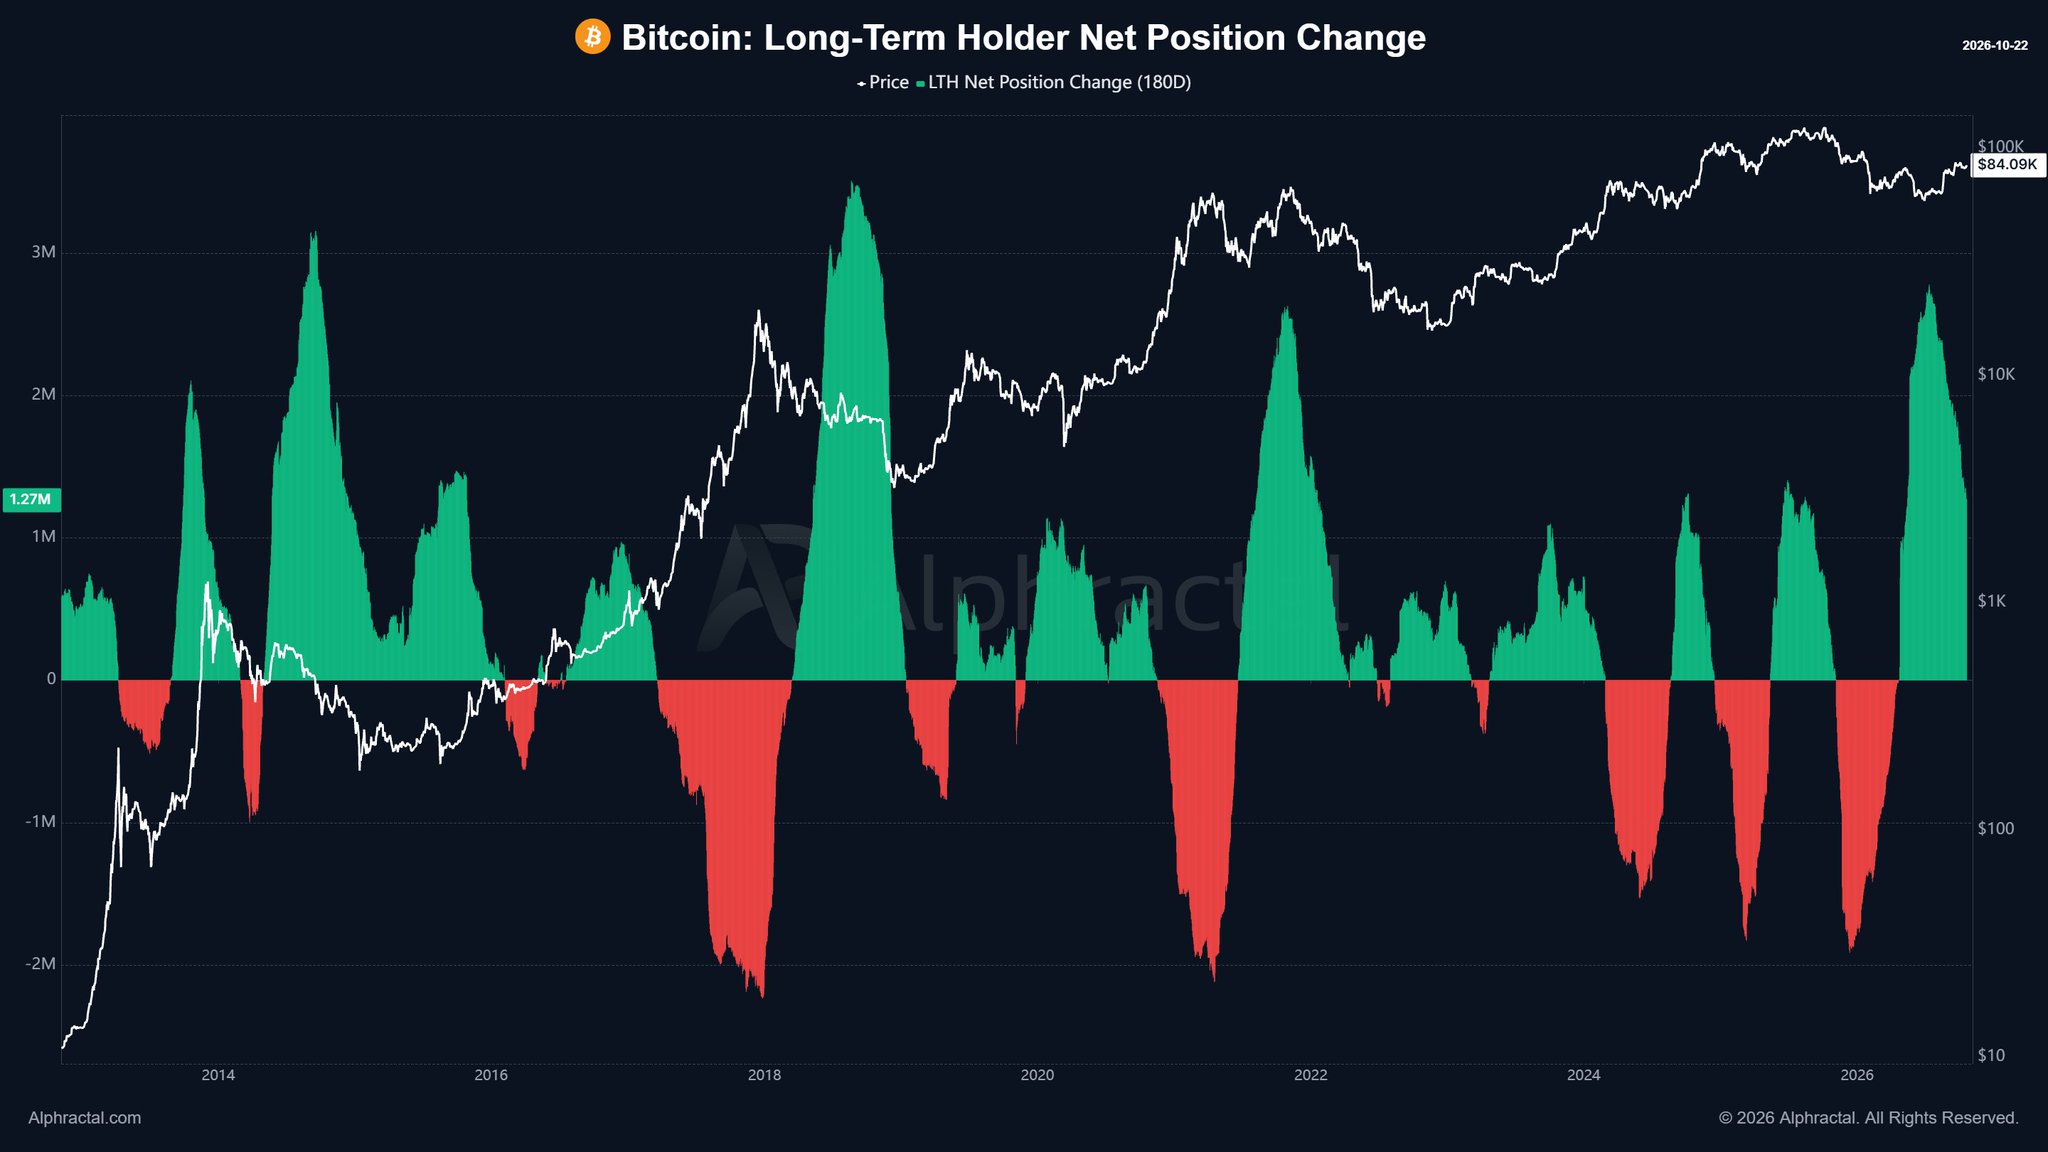
As of October 22, 2026, the LTH Net Position Change stands at +1.27 million BTC on a 180-day rolling basis. The chart shared by @Alphractal — spanning Bitcoin’s full price history from 2013 to 2026 — shows alternating green accumulation bars and red distribution bars corresponding precisely to Bitcoin’s documented bull and bear cycles. The current reading is green, confirming net accumulation is still occurring. However, the visual shape of the bar at the far right of the chart is narrowing relative to prior green peaks, indicating the accumulation pace is tapering.
@Alphractal frames the core question directly: is this deceleration a temporary pause before another leg of accumulation resumes, or is it the early signal of the transition into a distribution phase? That distinction carries significant weight. In prior cycles, the metric crossing from positive to negative — or simply peaking and turning lower before going negative — has aligned with major market cycle tops. The current reading has not gone negative. But the slope is flattening.
Why Slowing Accumulation Matters More Than the Absolute Number
A common misreading of this metric is to focus only on whether it is positive or negative. That is incomplete. Long-term holders as a group tend to be the strongest-conviction participants in Bitcoin markets — accumulating through bear markets and gradually distributing as price climbs into euphoria. The velocity of their accumulation or distribution is the leading signal. A reading of +1.27 million BTC sounds strongly bullish in isolation. But if the same metric was at +2 million BTC sixty days ago and has been decelerating toward its current level, the direction of travel is as informative as the absolute level.
This dynamic has direct precedent. In prior cycles, LTH net accumulation peaked well before price peaked — with the distribution phase beginning as price continued to climb, meaning price and LTH behavior diverge at cycle tops. Retail and short-term speculators absorb the coins that LTHs are quietly offloading. If the current deceleration is the leading edge of that transition, Bitcoin at $81,765 could be in a later cycle stage than the price level alone suggests. For additional context on recent large-holder behavior, see Bitcoin Whale Liquidated for 121.33 BTC ($9.91M) as Market Drops.
What Alphractal’s Chart Reveals — Cycle Pattern Context
The full-history chart from @Alphractal places the current reading in explicit cycle context. Green bars — representing positive LTH net position change — dominated 2015–2017, 2019–2021, and again from late 2022 through the current period. Red bars representing net distribution coincided with the 2018 bear market, the mid-2021 correction, and the 2022 crash. The current green bar at the far right is still positive at +1.27 million BTC — but its visual height relative to the prior green peaks from 2020–2021 shows it is tapering, not accelerating. The chart’s left axis, labeled in increments of 1M BTC (3M, 2M, 1M, 0, -1M, -2M), places the current +1.27M reading at just above the midpoint of the prior accumulation range — not near its historical extreme.
That chart positioning matters. If the metric were at or near +2M to +3M and decelerating, the signal would be more urgently late-cycle. At +1.27M, there is room for the reading to re-accelerate — but the burden of evidence now sits with bulls to demonstrate that LTH accumulation is resuming, not ending. Recent large-holder rotation activity — such as the whale that dumped 1,917 BTC for $159M to rotate into ETH — adds texture to why the deceleration reading deserves scrutiny.
The Two Scenarios From Here
Bullish Scenario — Accumulation Re-Accelerates
If LTH Net Position Change stabilizes and begins re-accelerating from the +1.27M level, the deceleration would be classified as a mid-cycle consolidation rather than a cycle top signal. In prior instances where the metric briefly slowed before resuming, Bitcoin went on to register its highest prices of the cycle. A resumption of LTH accumulation velocity would shift the on-chain weight of evidence back toward continuation.
Bearish Scenario — Metric Rolls Over Toward Zero or Negative
If the 180-day rolling LTH Net Position Change continues to decelerate and approaches zero — or crosses negative — the historical pattern becomes unambiguous. Every prior instance of the metric transitioning from positive to negative has coincided with a major market cycle peak and subsequent bear market. At $81,765, a confirmed rollover in this metric would suggest distribution is underway at current price levels, with long-term holders offloading into market strength.
@Alphractal does not provide a specific price trigger — the signal here is metric-directional, not price-level dependent. Watch the 180-day LTH Net Position Change trajectory in the sessions and weeks ahead. That reading — not price action alone — will determine which of the two scenarios is playing out. For further reading on BTC relative to altcoin cycle signals, see SUI/BTC Holds August 2024 Low — Range High Is Now the Target.
The structure is this: +1.27 million BTC in net long-term holder accumulation over 180 days confirms the cohort has not yet become net sellers. But a decelerating positive reading, at this stage of the cycle, is historically the pre-distribution signal — the warning that appears before the inflection, not after it. Whether the current slowdown resolves into renewed accumulation or a genuine top-formation process is the single most consequential on-chain question Bitcoin faces at $81,765.
Frequently Asked Questions
What does a decelerating LTH Net Position Change mean for Bitcoin’s price outlook?
Has Bitcoin’s LTH Net Position Change gone negative before, and what happened each time?
What specific level or threshold would confirm the LTH accumulation trend is reversing?
Is a positive LTH Net Position Change of +1.27M BTC still bullish despite the slowdown?
Source: Alphractal · Published by CoinsProbe Markets Desk
The opinions and market insights shared on CoinsProbe represent the views of individual authors based on prevailing market conditions at the time of publication. Cryptocurrency investments carry significant risk and volatility. Readers are encouraged to conduct their own research and seek professional financial advice before making investment decisions. CoinsProbe and its contributors do not accept responsibility for financial losses or decisions made based on published content.
CoinsProbe may publish sponsored articles, affiliate links, or promotional collaborations. All sponsored material is clearly labeled to maintain transparency with our audience. Our editorial decisions remain fully independent, and advertising partnerships do not influence reviews, rankings, or published opinions.
Since 2023, CoinsProbe has delivered reliable insights on cryptocurrency, blockchain, and digital assets. Our content is created by experienced researchers and analysts who follow strict editorial standards focused on accuracy, transparency, and credibility. Every article is carefully reviewed and verified using trusted sources and current market data. We provide unbiased analysis and timely updates covering everything from emerging crypto projects to major industry developments.