
Key Takeaways
- Bitcoin is trading inside a consolidation range that closely mirrors a previous bullish fractal.
- Price action suggests BTC is entering a Wyckoff Spring zone, where a final liquidity sweep may occur.
- A brief dip toward the $78,000 demand area could act as a last shakeout rather than a breakdown.
- If buyers absorb supply near this zone, BTC may reclaim range support and attempt a rebound.
- The broader structure still favors accumulation, with downside moves potentially serving as fuel for the next upside leg.
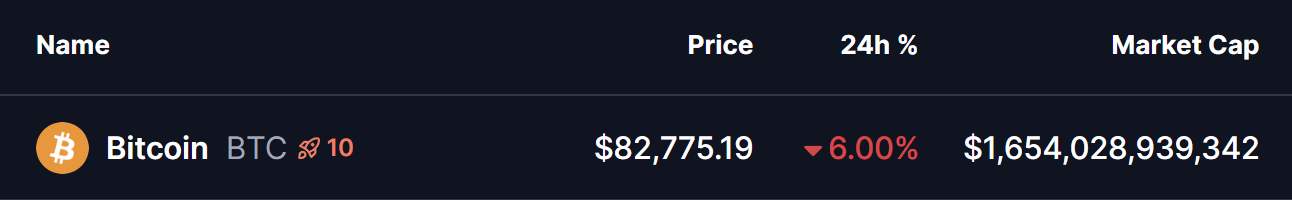
The broader cryptocurrency market has come under intense pressure over the last 24 hours, with Bitcoin (BTC) dropping nearly 6% to below $83,000, marking its lowest level of 2026 so far.
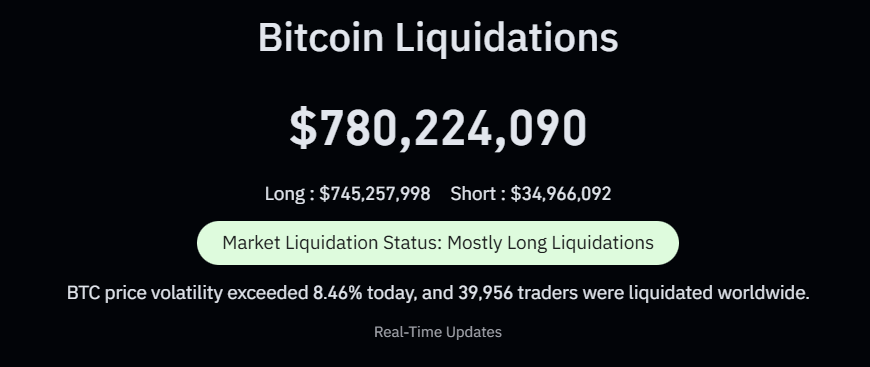
The sharp decline triggered around $780 million in liquidations, with an overwhelming $745 million coming from long positions, highlighting how aggressively leveraged the market had become.
This move did not happen in isolation. A broader sell-off in risk assets, weakness in US equities, aggressive leverage unwinding, and rising Bitcoin ETF outflows all combined to fuel the downside. Fear accelerated quickly—but the chart suggests this move may be more strategic than it appears at first glance.
Spot ETF Outflows Accelerate
Adding to the pressure, Bitcoin spot ETFs recorded $817 million in net outflows on January 29 (ET), according to SoSoValue data.
- BlackRock’s IBIT saw the largest single-day outflow at $318 million, though it still holds a massive $62.48 billion in historical net inflows.
- Fidelity’s FBTC followed with $168 million in outflows, while its total historical net inflow stands at $11.26 billion.
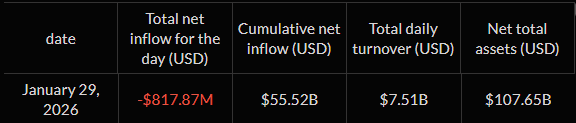
Despite the short-term outflows, the total net asset value of Bitcoin spot ETFs remains high at $107.65 billion, signaling that long-term capital has not exited the market—only repositioned.
Wyckoff Structure Comes Into Focus
According to the latest chart analysis by B4CRYPTOTW, Bitcoin’s current price action closely aligns with a Wyckoff Accumulation schematic, particularly a Spring phase near the lower boundary of the broader trading range.
On the daily chart, BTC has spent weeks consolidating within a defined range. The recent breakdown below support does not show characteristics of a trend failure. Instead, it resembles a liquidity grab—a move designed to force weak hands out of the market:
- Price dips below key support
- Stop losses are triggered
- Long positions are liquidated
- Fear peaks
- Smart money absorbs supply quietly
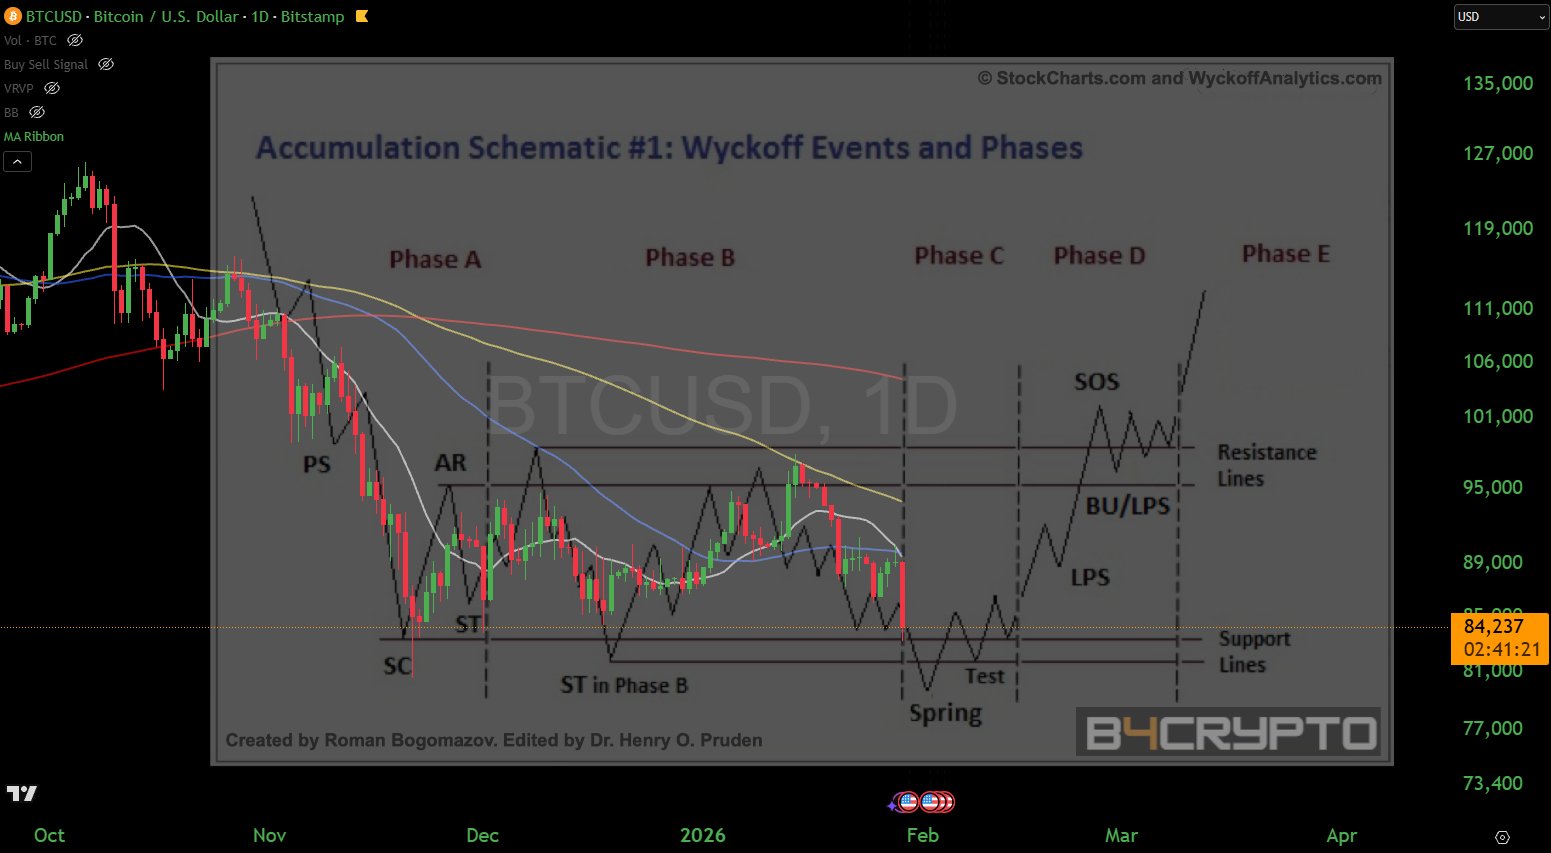
This is how Wyckoff ranges typically resolve before expansion. The largest red candles often appear during Springs, not during true breakdowns.
Spring Zone in Play: Could $78K Be Touched?
At the same time, price action suggests Bitcoin is now moving deeper into the Spring zone, where one more downside sweep cannot be ruled out. If selling pressure continues in the short term, BTC could briefly dip toward the lower demand area around $78,000, a level that sits just below the current range support and fits the profile of a classic Wyckoff stop-hunt.
Such a move would likely be fast, emotional, and driven by panic, designed to flush out the remaining late longs. Importantly, this would not signal structural weakness. In Wyckoff terms, a deeper Spring often represents the final shakeout, where supply is fully absorbed before a reversal takes shape.
If this Spring scenario plays out, Bitcoin may now be transitioning into a testing phase, where price holds above the lows before strength gradually re-emerges.What Could Come Next for $BTC?
If this Spring scenario plays out, Bitcoin may now be transitioning into a testing phase, where price holds above the lows before strength gradually re-emerges.
What Could Come Next for $BTC?
As long as Bitcoin avoids sustained acceptance below the lower demand zone, this move is more likely to be remembered as a shakeout, not a breakdown. A successful defense of the Spring area could mark the foundation for the next expansion leg once volatility cools and liquidity resets.
Disclaimer: The views and analysis presented in this article are for informational purposes only and reflect the author’s perspective, not financial advice. Technical patterns and indicators discussed are subject to market volatility and may or may not yield the anticipated results. Investors are advised to exercise caution, conduct independent research, and make decisions aligned with their individual risk tolerance.
About Author: Nilesh Hembade is the Founder and Lead Author of Coinsprobe, with over 5 years of experience in the cryptocurrency and blockchain industry. Since launching Coinsprobe in 2023, he has been providing daily, research-driven insights through in-depth market analysis, on-chain data, and technical research.

The opinions and market insights shared on CoinsProbe represent the views of individual authors based on prevailing market conditions at the time of publication. Cryptocurrency investments carry significant risk and volatility. Readers are encouraged to conduct their own research and seek professional financial advice before making investment decisions. CoinsProbe and its contributors do not accept responsibility for financial losses or decisions made based on published content.
CoinsProbe may publish sponsored articles, affiliate links, or promotional collaborations. All sponsored material is clearly labeled to maintain transparency with our audience. Our editorial decisions remain fully independent, and advertising partnerships do not influence reviews, rankings, or published opinions.
Since 2023, CoinsProbe has delivered reliable insights on cryptocurrency, blockchain, and digital assets. Our content is created by experienced researchers and analysts who follow strict editorial standards focused on accuracy, transparency, and credibility. Every article is carefully reviewed and verified using trusted sources and current market data. We provide unbiased analysis and timely updates covering everything from emerging crypto projects to major industry developments.