
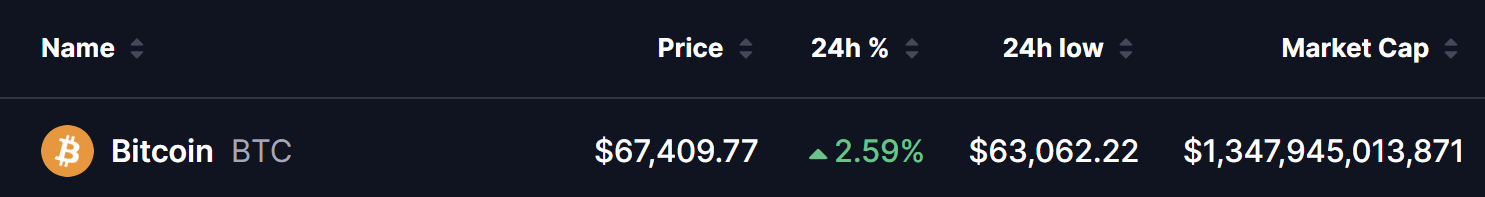
Bitcoin (BTC) has demonstrated remarkable resilience in the face of escalating Middle East tensions, rebounding sharply after an initial sell-off triggered by U.S. and Israeli military strikes on Iran. As of March 1, 2026, BTC trades near $67,400, up over 2.59% in the past 24 hours after briefly dipping toward the $63,000 zone during peak panic.
The weekend volatility began after coordinated strikes across Iranian provinces were confirmed, followed by retaliatory threats that rattled global markets. Oil prices spiked on fears surrounding the Strait of Hormuz, equities signaled risk-off sentiment, and crypto—being a 24/7 market—reacted instantly.
Bitcoin plunged nearly 4% intraday, Ether dropped harder, and roughly $128 billion was wiped from total crypto market capitalization within an hour.
But the sell-off didn’t last.
Historical Parallels Hint at a Relief Bounce
Prominent analyst Benjamin Cowen highlighted an interesting historical parallel. During the February 2022 Russia–Ukraine invasion, Bitcoin initially plunged nearly 8% as fear gripped markets. However, within days, BTC staged a powerful rebound—posting one of its strongest single-day recoveries in over a year.
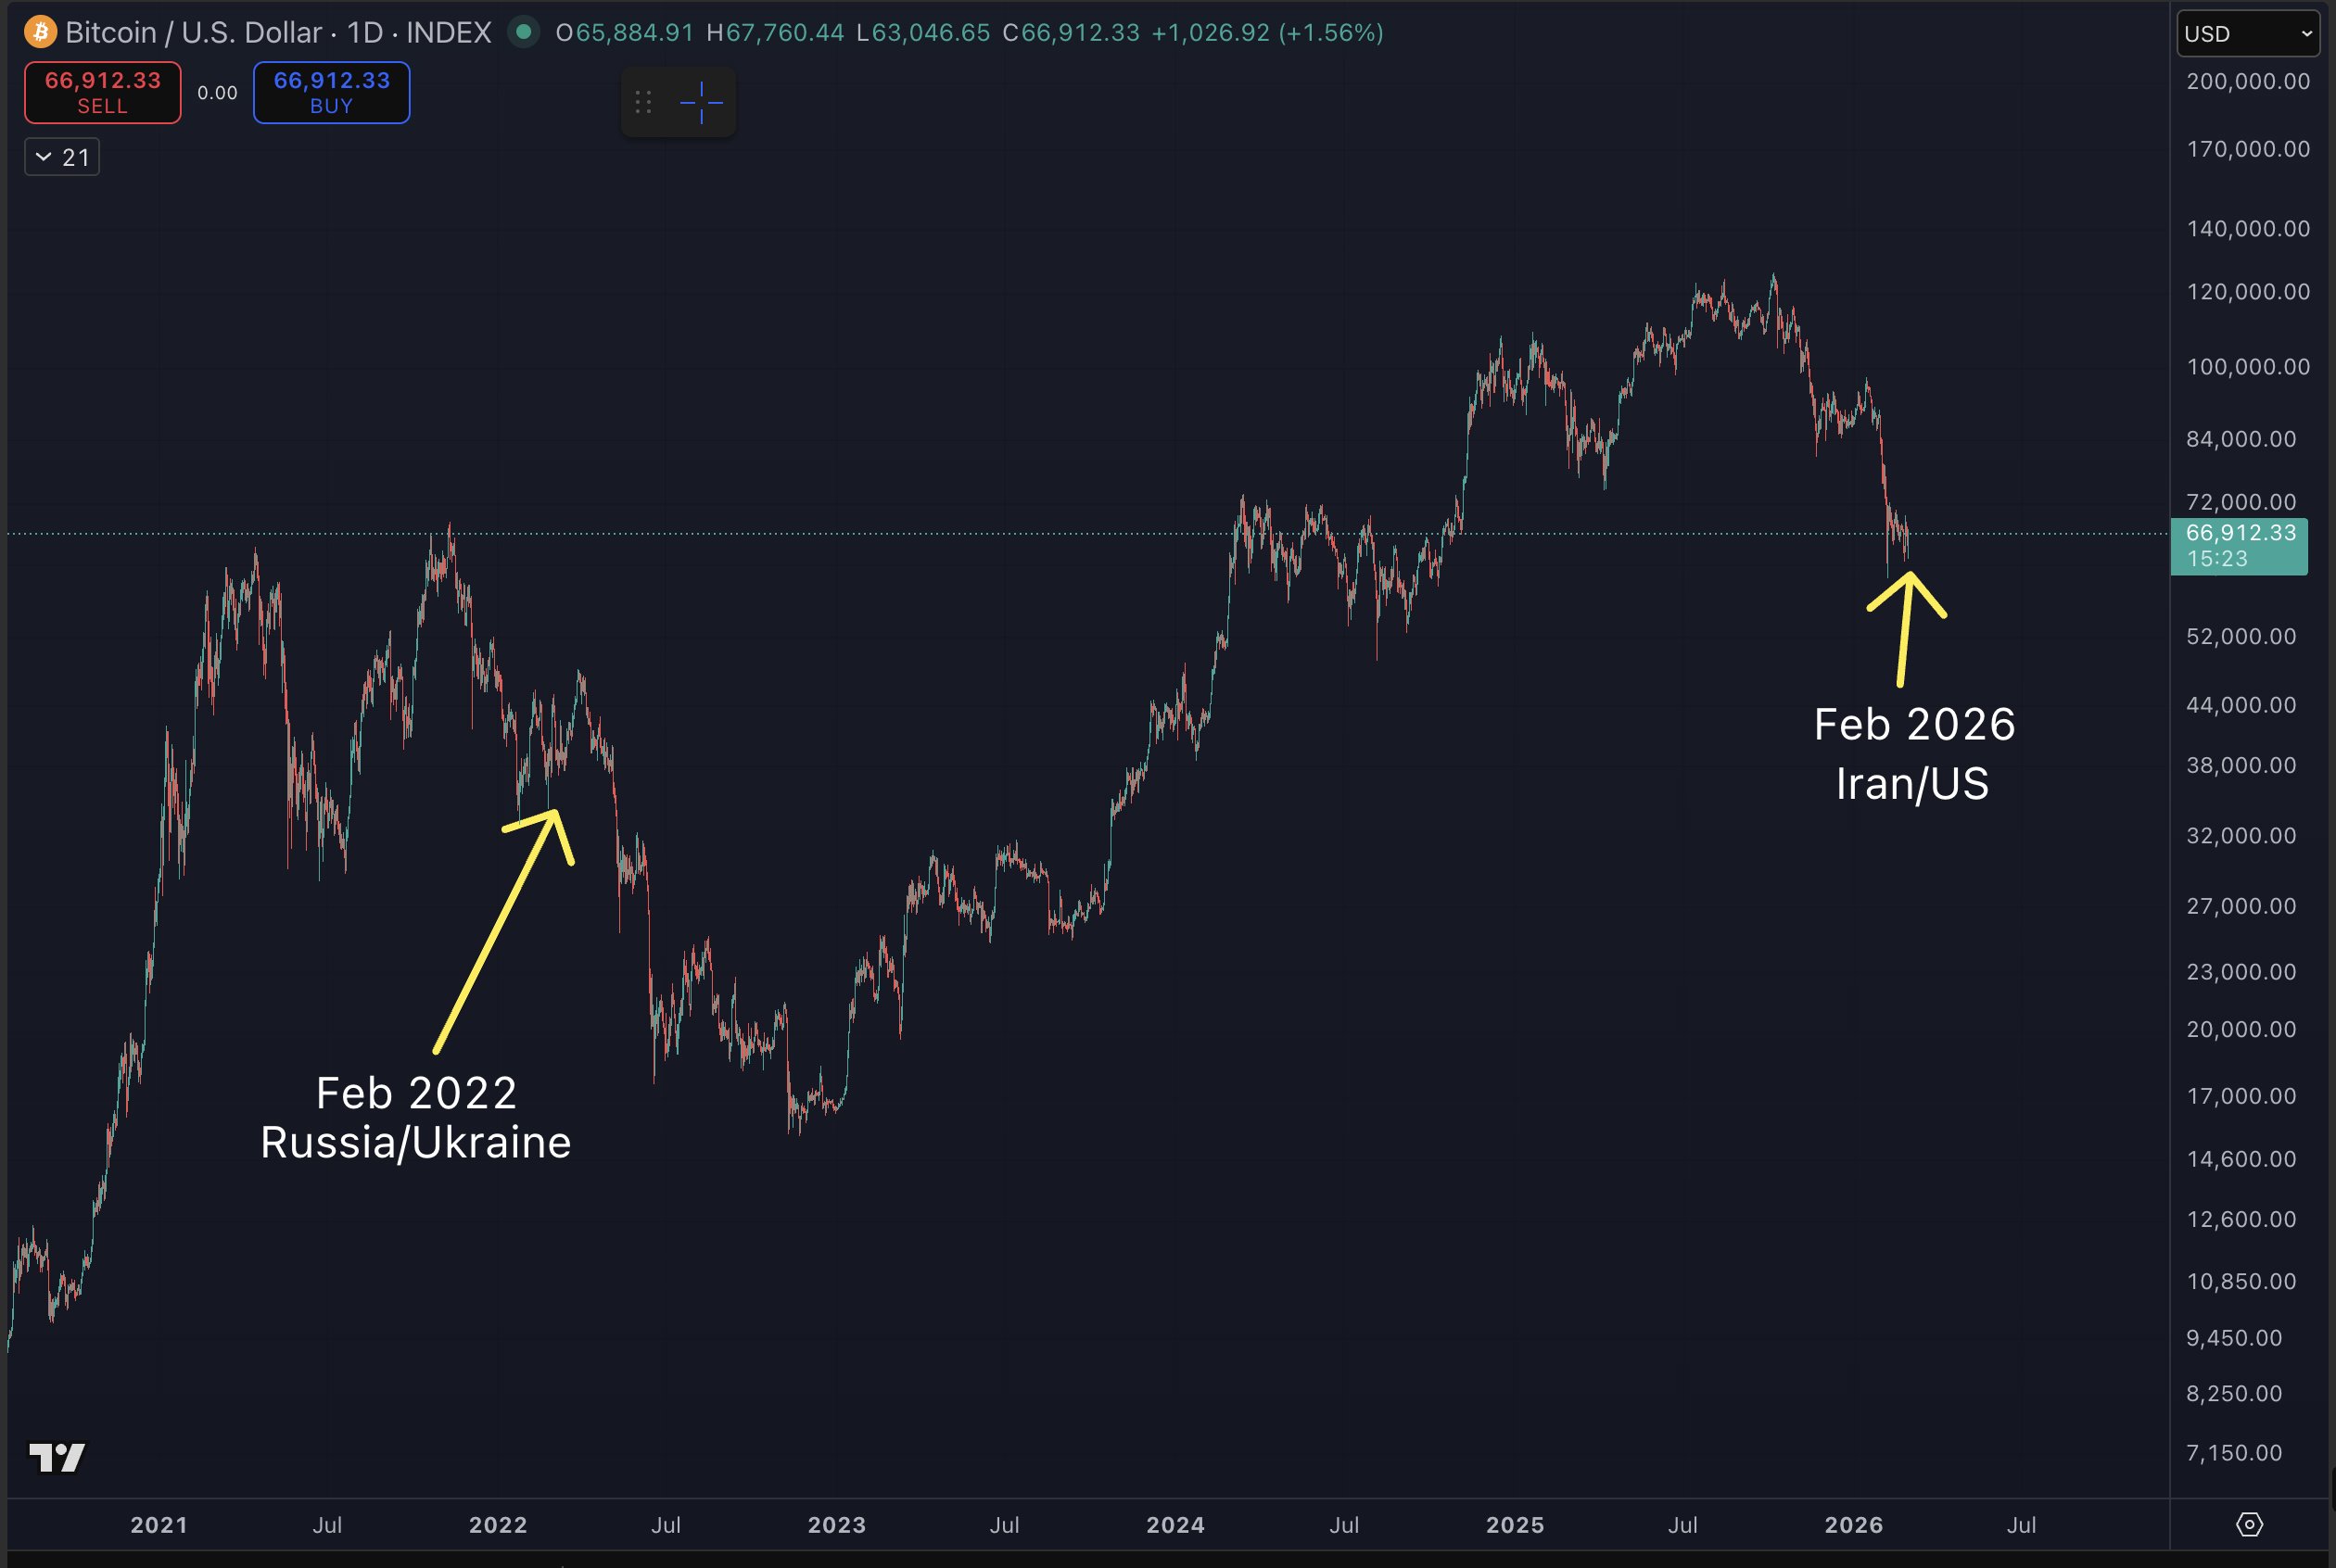
By late March 2022, Bitcoin had rallied roughly 27% from its local bottom.
Cowen notes this recurring pattern during geopolitical shocks:
- Initial panic liquidation
- Short-term relief rally
- Formation of a lower high within a broader bearish structure
His caution? Even if Bitcoin rallies in March 2026, it may still print a lower high, consistent with bear market behavior rather than signaling a new bull cycle.
Descending Channel Wedge Supporting Short-Term Upside
From a technical perspective, the daily chart adds weight to the relief-bounce narrative.
Bitcoin has been trading inside a descending channel—a structure defined by lower highs and lower lows. Recently:
- BTC tested the lower boundary near $59,980
- Strong buying interest triggered a bounce
- Price reclaimed and is now holding above the $62,500 support zone
This reaction suggests that sellers may be temporarily exhausted at the lower channel boundary.
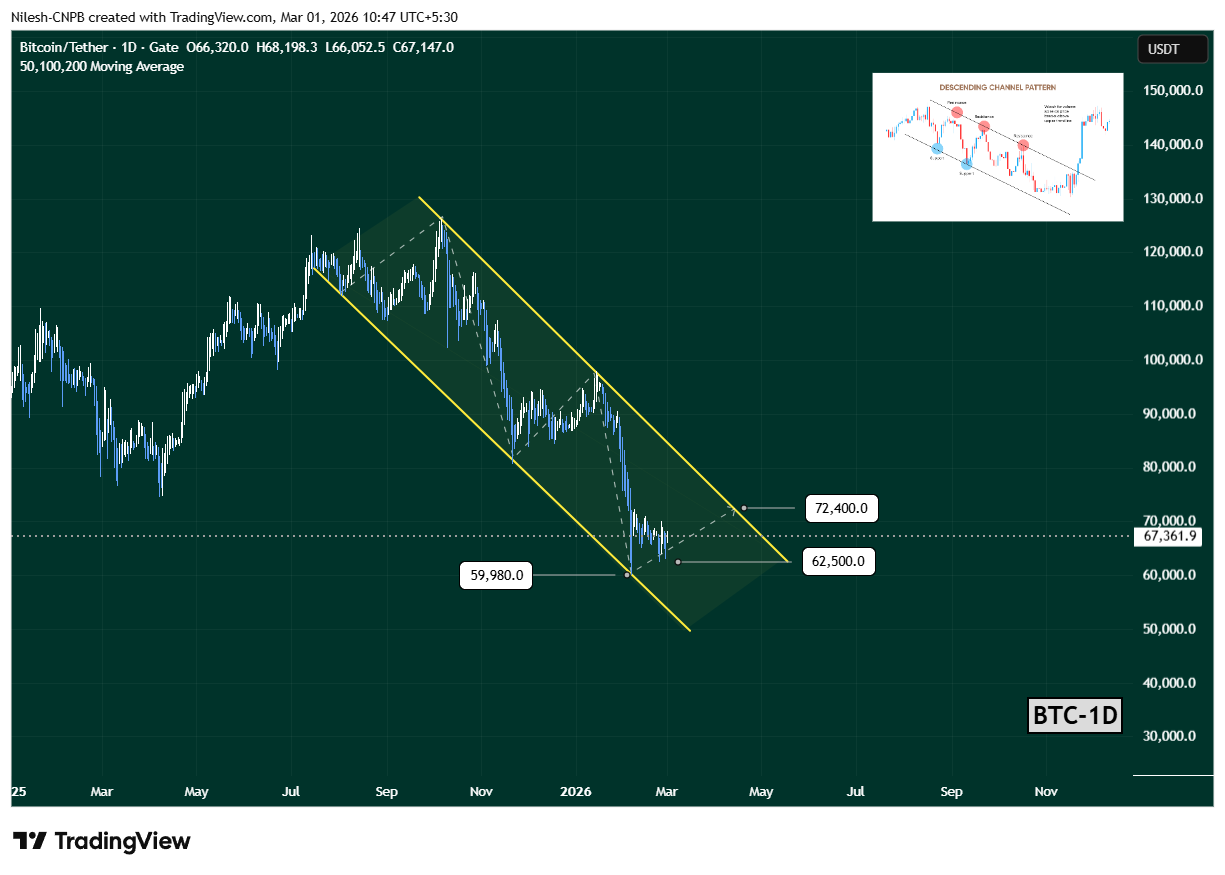
If the pattern continues to play out, Bitcoin could climb toward the upper boundary of the channel near $72,400, which aligns with prior rejection zones and descending trendline resistance.
That area would be a critical test.
What to Watch This Week
With U.S. equity markets reopening and Bitcoin ETFs resuming full participation, volatility could expand again.
Bullish Scenario:
- BTC holds above $62,500
- Momentum builds toward $72,400
- Breakout above channel resistance
Bearish Scenario:
- Failure to sustain gains
- Rejection near channel resistance
- Breakdown back below $62,000
For now, Bitcoin’s geopolitical bounce looks real—but whether it evolves into sustained recovery or simply forms another lower high remains the key question.
The coming weeks in March could define the structure for the next major move.

The opinions and market insights shared on CoinsProbe represent the views of individual authors based on prevailing market conditions at the time of publication. Cryptocurrency investments carry significant risk and volatility. Readers are encouraged to conduct their own research and seek professional financial advice before making investment decisions. CoinsProbe and its contributors do not accept responsibility for financial losses or decisions made based on published content.
CoinsProbe may publish sponsored articles, affiliate links, or promotional collaborations. All sponsored material is clearly labeled to maintain transparency with our audience. Our editorial decisions remain fully independent, and advertising partnerships do not influence reviews, rankings, or published opinions.
Since 2023, CoinsProbe has delivered reliable insights on cryptocurrency, blockchain, and digital assets. Our content is created by experienced researchers and analysts who follow strict editorial standards focused on accuracy, transparency, and credibility. Every article is carefully reviewed and verified using trusted sources and current market data. We provide unbiased analysis and timely updates covering everything from emerging crypto projects to major industry developments.