Date: Mon, March 24, 2025 | 07:34 AM GMT
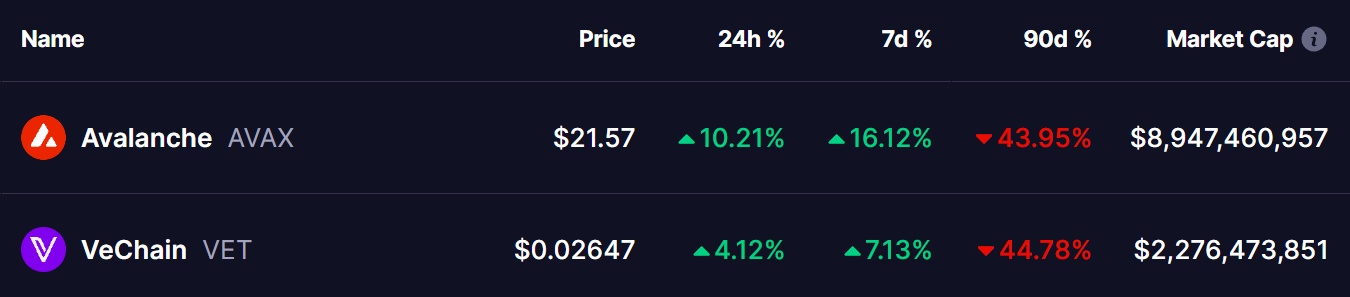
The crypto market is showing signs of a rebound as Ethereum (ETH) gains 9% in a week, climbing above the $2,050 mark. This shift in sentiment is providing relief to altcoins, many of which have suffered heavy corrections over the past 90 days.
Among them, Avalanche (AVAX) and VeChain (VET) are displaying promising price action. AVAX has surged 16% over the past week, successfully breaking out of a key technical pattern, while VET appears to be mirroring a similar setup, positioning itself for a potential breakout.
Avalanche (AVAX) Breaks Out of Falling Wedge
AVAX has successfully broken out of a falling wedge pattern, a formation typically seen as bullish. The token surpassed the upper trendline of the wedge around the $19.20 range last week, signaling a shift in sentiment.
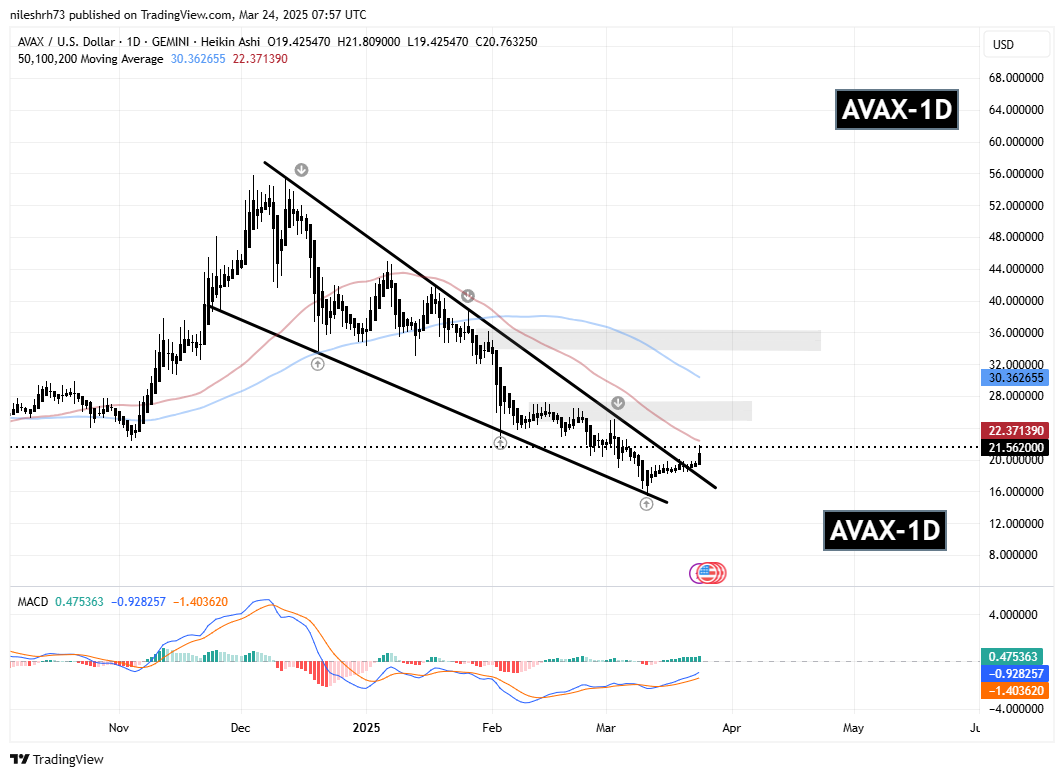
Currently, AVAX is trading around $21.56, testing key resistance at the 50-day moving average (MA). If the bullish momentum continues and AVAX breaks above this MA, the next resistance lies at the $26.93 price zone, followed by the 100-day MA and the $36.22 level, representing a 66% increase from the current price.
The MACD indicator on the daily chart shows a positive crossover, where the MACD line is moving above the signal line. This is a classic bullish signal, indicating that momentum is shifting in favor of the bulls.
VeChain (VET) Gearing Up for a Potential Breakout
Similar to AVAX, VET has been trading within a falling wedge since reaching its $0.036 peak in early December. Recently, the token bounced from the lower trendline support at $0.020 and is now trading at $0.026, approaching a crucial breakout point.
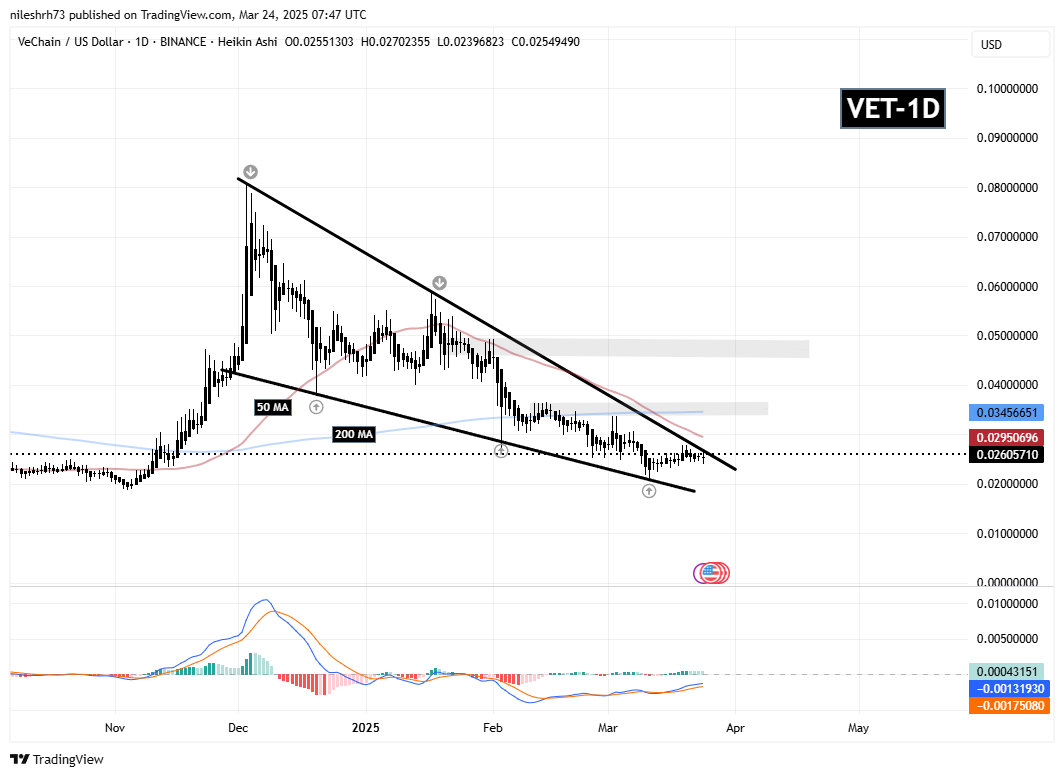
A confirmed breakout and retest of the wedge’s upper boundary could push VET toward the 50-day moving average at $0.029. If buying pressure sustains, the next major resistance would be at $0.036 and the 200-day MA, with a further move toward $0.049, representing a 90% potential upside from current levels.
The MACD indicator for VET is showing early signs of bullish divergence, suggesting that selling pressure is weakening. If the MACD line crosses above the signal line in the coming days, it would confirm a trend reversal and increase the likelihood of an upward breakout.
Final Thoughts
AVAX’s breakout has sparked bullish momentum, and if VET follows the same path, it could soon see significant gains. The technical patterns suggest positive momentum ahead, but there is still room for consolidation before a confirmed breakout occurs.

As always, traders should monitor key resistance levels, volume confirmation, and broader market sentiment before making any investment decisions.
Disclaimer: This article is for informational purposes only and should not be considered financial advice. Always conduct your own research before investing in cryptocurrencies.

The opinions and market insights shared on CoinsProbe represent the views of individual authors based on prevailing market conditions at the time of publication. Cryptocurrency investments carry significant risk and volatility. Readers are encouraged to conduct their own research and seek professional financial advice before making investment decisions. CoinsProbe and its contributors do not accept responsibility for financial losses or decisions made based on published content.
CoinsProbe may publish sponsored articles, affiliate links, or promotional collaborations. All sponsored material is clearly labeled to maintain transparency with our audience. Our editorial decisions remain fully independent, and advertising partnerships do not influence reviews, rankings, or published opinions.
Since 2023, CoinsProbe has delivered reliable insights on cryptocurrency, blockchain, and digital assets. Our content is created by experienced researchers and analysts who follow strict editorial standards focused on accuracy, transparency, and credibility. Every article is carefully reviewed and verified using trusted sources and current market data. We provide unbiased analysis and timely updates covering everything from emerging crypto projects to major industry developments.