Date: Sun, Nov 10, 2024, 05:54 PM GMT
The cryptocurrency market is experiencing a significant rally, fueled by Bitcoin’s (BTC) relentless upward momentum, reaching new all-time highs since Donald Trump’s recent U.S. presidential election victory on November 5. As of today, Bitcoin has set a new record at $80,714, injecting bullish energy into the broader crypto market and spurring positive price action across major altcoins.
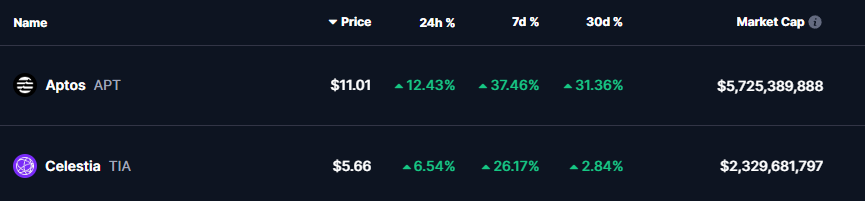
In this wave, Aptos (APT), a prominent Layer-1 token, and Celestia (TIA), a modular blockchain protocol, have managed to deliver impressive gains. APT has surged by 12%, while TIA is up by 6%, showing strong signs of bullish momentum.
Notably, Jonathan Carter, a well-known crypto analyst, has provided an in-depth technical analysis of these two assets, suggesting potential breakouts. Here’s a closer look at the technical outlook for APT and TIA and what might come next.
Aptos (APT) Technical Analysis
The recent price action for Aptos (APT) is showcasing a bullish setup on the 3-day chart. APT is currently forming a rounding bottom pattern, which often signifies a trend reversal and the beginning of an upward movement. Key elements to consider:
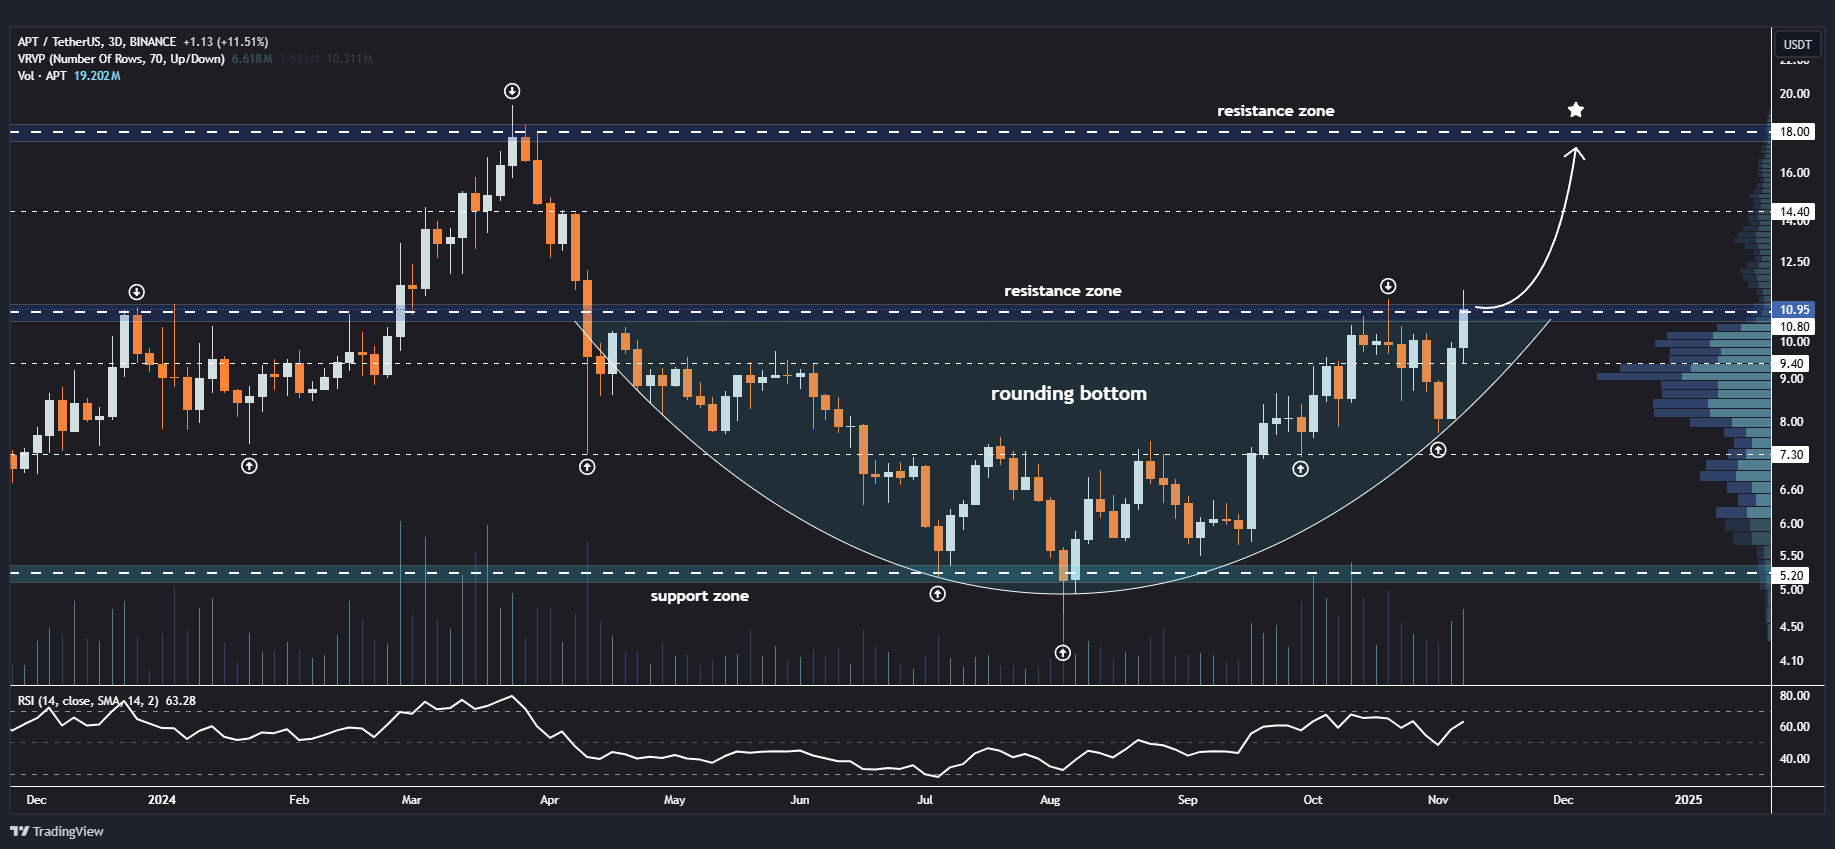
- Resistance Levels: The chart highlights significant resistance around the $11.10 zone. Breaking above this resistance could set APT up for a substantial rally, with the next target in the $14.40-$18.00 range.
- Support Zone: APT has consistently found support around the $7.30 level, indicating strong buying interest at these lower levels.
- Volume: A steady increase in volume suggests growing interest in APT, supporting the bullish case.
- RSI: The Relative Strength Index (RSI) is currently above 60, reflecting growing momentum without being overbought, leaving room for further upside.
- Outlook: Should APT manage a clean breakout above the $11.10 resistance, the rounding bottom pattern indicates that APT could target higher levels, possibly in the $14-$18 range. With Bitcoin’s rally providing market-wide momentum, this scenario seems increasingly likely.

Celestia (TIA) Technical Analysis
Celestia (TIA) also shows an encouraging setup on the 3-day chart, with a broadening wedge pattern forming—a classic indication of potential trend continuation.
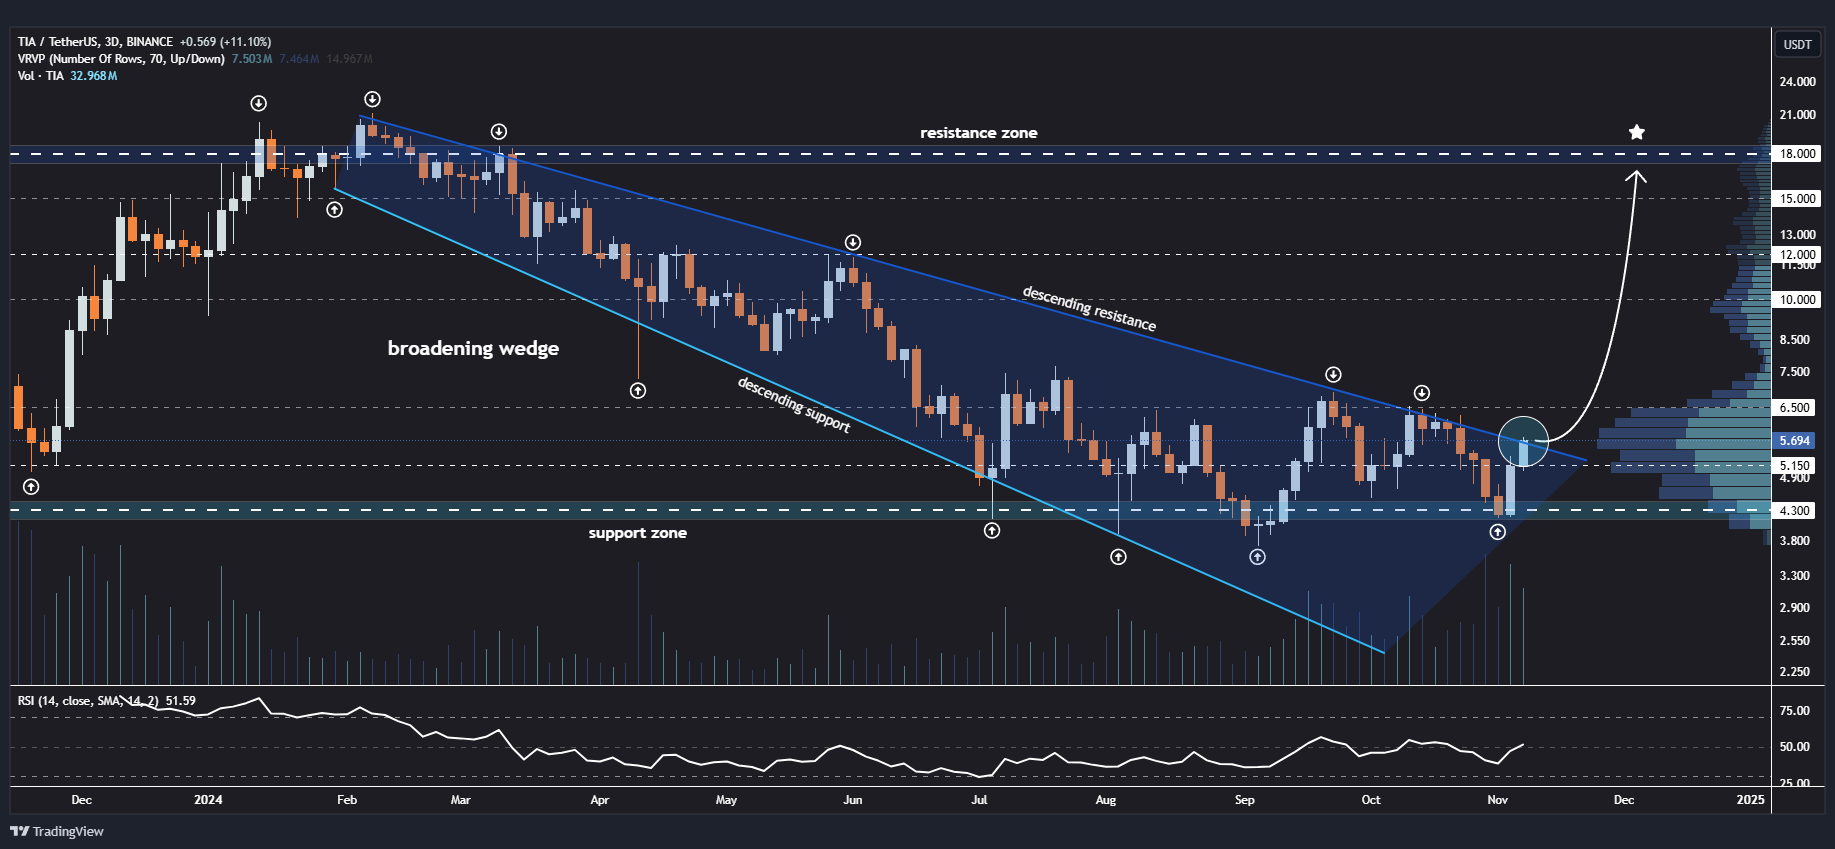
- Descending Resistance and Support: The broadening wedge pattern is marked by descending resistance and support lines, with TIA currently testing the descending resistance near $5.70. A breakout above this level could signify a trend reversal.
- Support Zone: TIA has established a firm support zone around the $4.30 mark, with recent price action bouncing off this level and moving towards higher resistance.
- Volume Profile: The volume profile reveals a clustering of trading activity in the $5-$6 range, suggesting significant interest and liquidity at these levels. A breakout above this zone could attract new buyers, pushing prices higher.
- RSI: TIA’s RSI stands just above 50, indicating a neutral stance but trending positively. A move above 60 would further reinforce the bullish trend, especially if accompanied by increased volume.
- Resistance Zone: If TIA can break out from its descending resistance, it could rally toward the resistance zone between $10 and $12. An extended rally might even see TIA aiming for the $18 target, though this would require sustained buying interest.
What to Expect Next?
The technical setups for both APT and TIA are looking bullish, with BTC’s continued rally acting as a powerful catalyst. Both assets have formed reliable patterns—APT with its rounding bottom and TIA with its broadening wedge—that could lead to significant upward movement if current resistance levels are broken. Given the broader market optimism and strong interest in both assets, a rally could very well be on the horizon for APT and TIA.
Conclusion
The current technical indicators for Aptos (APT) and Celestia (TIA) point to potential breakouts as BTC continues to push higher, fueling overall market sentiment. Should the current momentum persist, APT and TIA could see considerable upside in the near future. However, as always, investors should consider market volatility and conduct thorough research before making trading decisions.
Disclaimer: This article is for informational purposes only and is not financial advice. Always conduct your own research before investing in cryptocurrencies.

The opinions and market insights shared on CoinsProbe represent the views of individual authors based on prevailing market conditions at the time of publication. Cryptocurrency investments carry significant risk and volatility. Readers are encouraged to conduct their own research and seek professional financial advice before making investment decisions. CoinsProbe and its contributors do not accept responsibility for financial losses or decisions made based on published content.
CoinsProbe may publish sponsored articles, affiliate links, or promotional collaborations. All sponsored material is clearly labeled to maintain transparency with our audience. Our editorial decisions remain fully independent, and advertising partnerships do not influence reviews, rankings, or published opinions.
Since 2023, CoinsProbe has delivered reliable insights on cryptocurrency, blockchain, and digital assets. Our content is created by experienced researchers and analysts who follow strict editorial standards focused on accuracy, transparency, and credibility. Every article is carefully reviewed and verified using trusted sources and current market data. We provide unbiased analysis and timely updates covering everything from emerging crypto projects to major industry developments.