Date: Thu, June 05, 2025 | 09:40 AM GMT
The cryptocurrency market experienced a sharp pullback recently, dragging most major tokens into the red. Bitcoin (BTC) briefly dropped to around $104,000, while Ethereum (ETH) slipped to $2,600—both retracing from recent highs. This mini correction also impacted several AI agent tokens, including AI16Z (AI16Z).
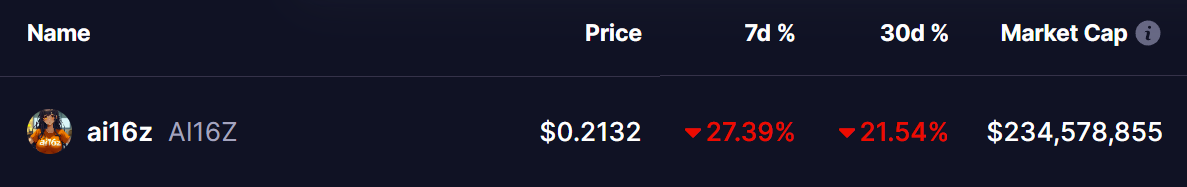
AI16Z saw a weekly decline of over 27%, wiping out its monthly gains. But interestingly, a key harmonic structure forming on the lower timeframes is now showing signs of strength — potentially pointing toward a short-term bullish reversal.
Harmonic Pattern Signals Bounce Back
On the 4-hour chart, AI16Z appears to be forming a Bearish Crab harmonic pattern — a well-known technical setup that typically predicts a bullish rally toward a reversal zone (point D), before a potential larger correction.
The pattern started from point X near $0.3272 on May 27, which saw a sharp decline to point A around $0.1941 on May 31.
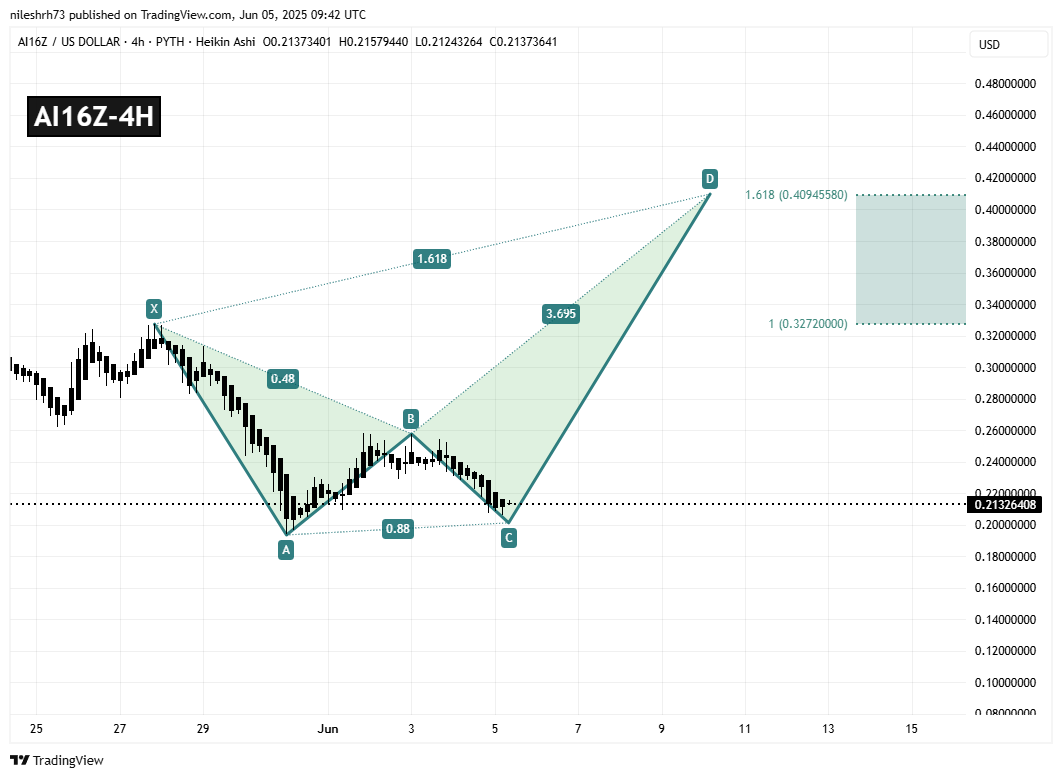
The AB leg retraced approximately 48% of the XA leg — aligning well with the ideal Fibonacci levels for a Crab setup. Then the BC leg extended to a 0.88 retracement, forming a deeper pullback that is characteristic of harmonic geometry.
The price action from point C appears to be forming the start of the final leg — CD — which, if completed, could drive AI16Z sharply higher in the coming days.
What’s Next for AI16Z?
If the pattern continues to play out, the target for the final point D sits at around $0.4094, which is the 1.618 Fibonacci extension of the XA leg. This would represent a potential upside of nearly 91% from the current price around $0.213.
However, for this bullish scenario to remain valid, AI16Z must hold the support zone around $0.20 — the C point in the pattern. A breakdown below this area could invalidate the pattern and increase downside pressure.

Disclaimer: This article is for informational purposes only and not financial advice. Always conduct your own research before investing in cryptocurrencies.

The opinions and market insights shared on CoinsProbe represent the views of individual authors based on prevailing market conditions at the time of publication. Cryptocurrency investments carry significant risk and volatility. Readers are encouraged to conduct their own research and seek professional financial advice before making investment decisions. CoinsProbe and its contributors do not accept responsibility for financial losses or decisions made based on published content.
CoinsProbe may publish sponsored articles, affiliate links, or promotional collaborations. All sponsored material is clearly labeled to maintain transparency with our audience. Our editorial decisions remain fully independent, and advertising partnerships do not influence reviews, rankings, or published opinions.
Since 2023, CoinsProbe has delivered reliable insights on cryptocurrency, blockchain, and digital assets. Our content is created by experienced researchers and analysts who follow strict editorial standards focused on accuracy, transparency, and credibility. Every article is carefully reviewed and verified using trusted sources and current market data. We provide unbiased analysis and timely updates covering everything from emerging crypto projects to major industry developments.