
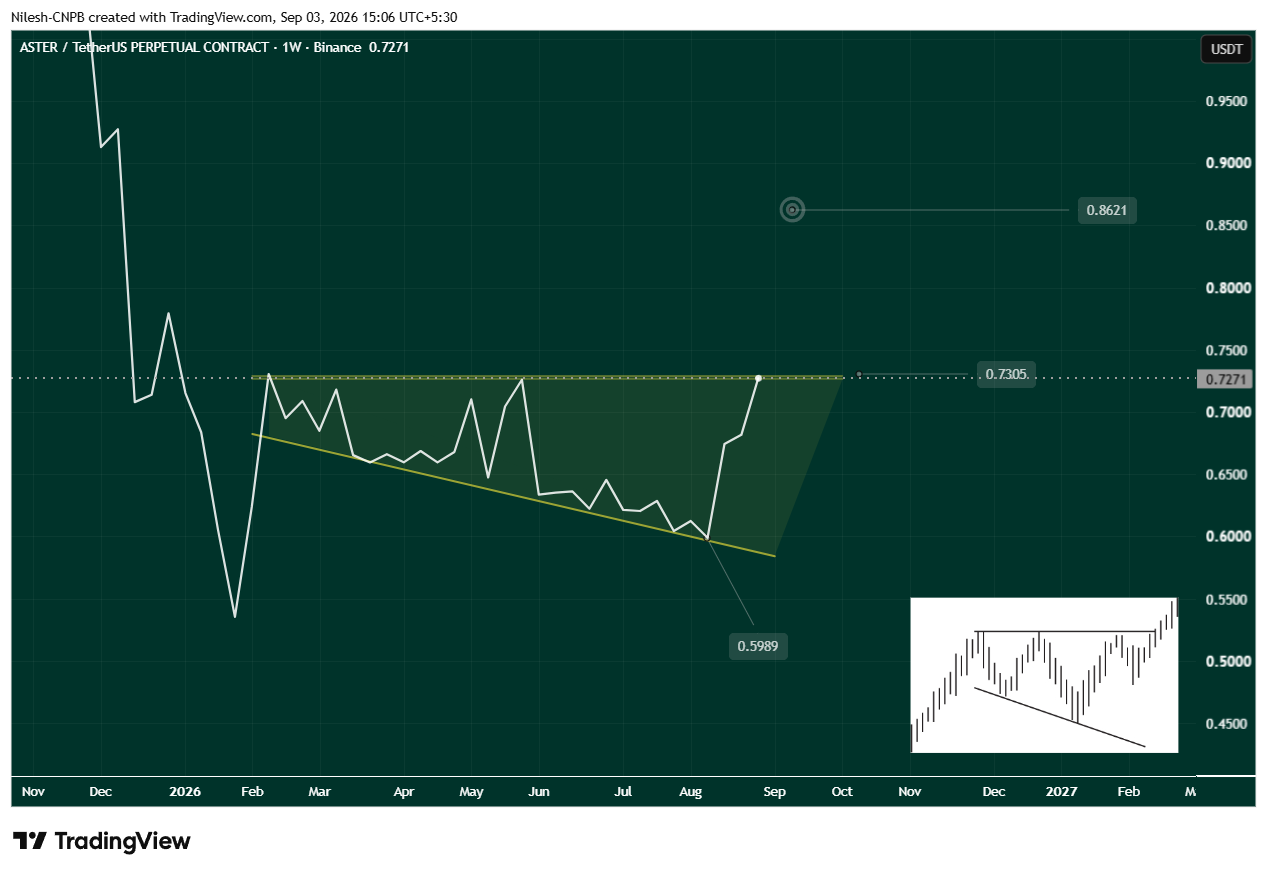
- ASTER is trading at $0.7299 — up 4.22% in 24 hours and 20.11% over 30 days — testing the critical $0.7305 horizontal resistance of a right-angled descending broadening wedge that has been building since early 2026.
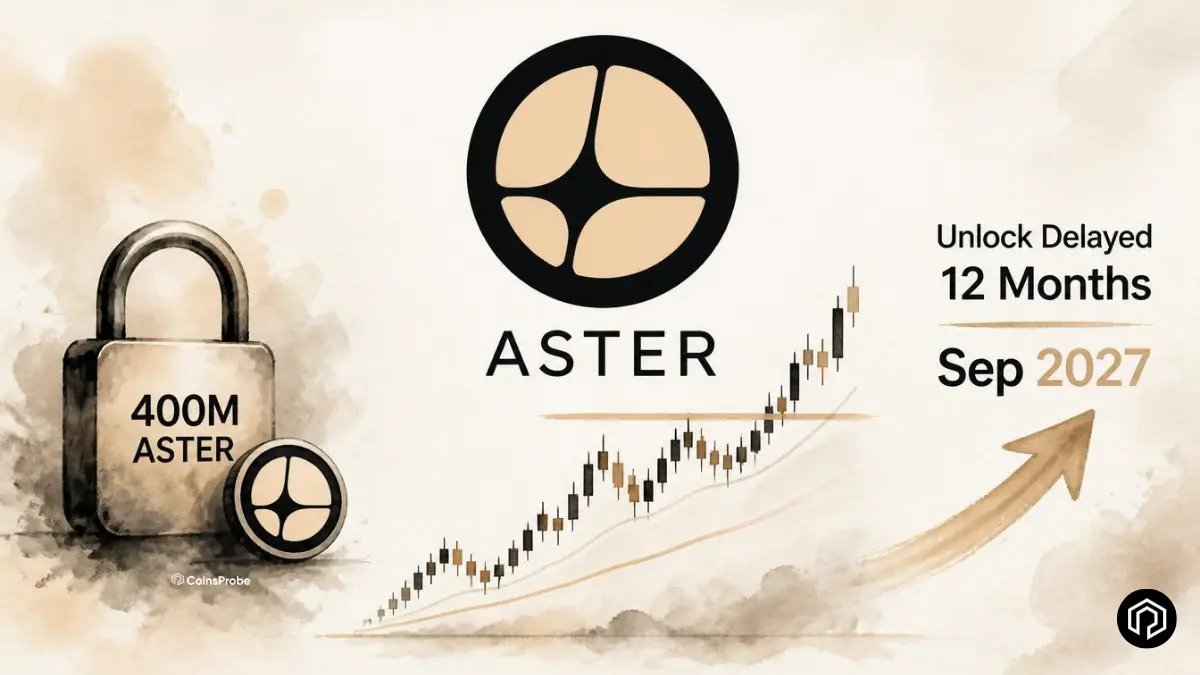
- Aster officially extended the Team allocation cliff by 12 months on September 1 — delaying 400 million ASTER (5% of max supply) from beginning to vest until September 17, 2027, removing the scheduled monthly unlock that was due to start this month.
- A confirmed weekly close above $0.7305 opens the path toward $0.8621 — approximately 18% above the current price — while $0.66 is the key support if the breakout attempt is rejected.
Aster ($ASTER) is converging two significant developments at the same time — a major technical breakout test and a tokenomics update that materially reduces near-term supply pressure. The token is sitting at $0.7299 — essentially at the $0.7305 horizontal resistance of a months-long wedge pattern — on the same week the team announced that 400 million tokens due to begin vesting this month will now remain locked for another year.
The timing is not coincidental. Less near-term supply and a test of the most important technical level on the weekly chart are arriving simultaneously — and the market appears to be pricing both in.

ASTER Tokenomics Update — Team Cliff Extended
On September 1, 2026, Aster officially announced an update to its tokenomics: the cliff on the Team allocation has been extended by 12 months — from September 17, 2026 to September 17, 2027.
The Full Detail of the Change
| Parameter | Original Schedule | Updated Schedule |
|---|---|---|
| Team Allocation | 400,000,000 ASTER (5% of max supply) | Unchanged |
| Cliff Date | September 17, 2026 | September 17, 2027 |
| Monthly Vest Amount | 10,000,000 ASTER per month | Delayed — not starting until 2027 |
| Status Since TGE | Fully locked | Remains fully locked |
| Extension Duration | — | +12 months |
The practical implication is direct: 10,000,000 ASTER that was scheduled to begin vesting this month will not unlock until September 17, 2027 — and then monthly vesting begins from that later date. The 400 million token Team allocation that has been fully locked since the Token Generation Event (TGE) continues to be locked for another full year.
Buyback-and-Burn Mechanism Unchanged
The tokenomics update does not affect Aster’s buyback-and-burn program. The mechanism remains active: for every ASTER bought back from the market, an equal amount is burned from reserves — with the Team allocation burned first. This creates a deflationary offset to future vesting activity and remains unchanged under the updated schedule.
Why This Matters at This Specific Moment
The original September 17, 2026 cliff date was approaching within weeks of the current price action. The market had reason to anticipate that monthly 10 million ASTER unlocks were about to begin — a source of new supply entering circulation on a predictable schedule starting this month. The cliff extension eliminates that anticipated supply pressure entirely for the next 12 months.
The combination of an extended cliff with an unchanged buyback-and-burn mechanism means Aster’s near-term supply dynamics have improved materially: no new Team allocation tokens will enter the market until September 2027, while buybacks continue reducing the existing float in parallel.
ASTER Chart Analysis
The chart structure accompanying the tokenomics update is equally significant — and the two are arriving at the same price level simultaneously.
The Pattern Structure
ASTER’s weekly chart is displaying a right-angled descending broadening wedge — a pattern characterized by:
- A flat horizontal resistance line at the top (~$0.7305) that price has repeatedly tested without breaking
- A descending lower trendline that has been compressing price upward from below
- Broadening price swings within the wedge that indicate increasing volatility as the pattern matures
The pattern has been building since early 2026 — visible on the weekly chart from approximately February, with successive lower swing lows defining the descending trendline and the $0.7305 level acting as a consistent ceiling.
The Key Structural Levels
$0.5989 — The Wedge Low:
The most recent significant low within the pattern — the point at which price found support on the descending lower trendline and bounced sharply back toward the horizontal resistance. This low marks the deepest compression point of the wedge and the base of the current recovery move.
$0.7305 — Horizontal Resistance (The Breakout Line):
The flat top of the right-angled wedge — a level that has been tested multiple times since early 2026 without being broken on a sustained weekly closing basis. At the current price of $0.7299, ASTER is sitting essentially at this level — making the next few weekly candles the most important in the pattern’s development.
$0.8621 — The Breakout Target:
The measured move target if the wedge breakout confirms — approximately 18% above the current price. This level represents the projected price objective following a successful weekly close above $0.7305, based on the width of the wedge pattern applied to the breakout point.
$0.66 — Pullback Support:
The first meaningful support zone below the resistance test — the level where bulls would need to defend a rejection if the $0.7305 breakout attempt fails to sustain. A hold above $0.66 on any pullback would keep the wedge structure intact for another breakout attempt.
The Inset Chart — A Parallel Structure
The weekly chart includes an inset showing what appears to be a similar ascending wedge or channel structure on a different timeframe — illustrating that the broadening pattern and upward momentum visible on the main chart has a comparable structure being tracked at a different scale. This suggests the breakout dynamic is being monitored across multiple timeframes simultaneously.
Why Both Stories Matter Together
The tokenomics update and the technical setup are not independent narratives — they are reinforcing the same near-term thesis from two different directions:
From the supply side: The 12-month cliff extension removes 10,000,000 ASTER per month from the near-term circulation schedule — supply that the market had anticipated would begin entering from this month. Removing anticipated supply at a resistance test reduces the overhead selling pressure at the exact level where the technical breakout needs the most help.
From the demand side: The right-angled descending broadening wedge approaching its horizontal resistance after bouncing from the $0.5989 low is a constructive technical setup — the pattern structure suggests accumulation has been occurring within the wedge, and the sharp bounce from the wedge’s lower trendline has brought price to the breakout line.
The convergence: ASTER is attempting to break the $0.7305 horizontal resistance — the most important technical level on its weekly chart — at the same time that a supply-reducing tokenomics change has removed the most immediate near-term selling catalyst. That combination of technical and fundamental alignment is what has put the token back in focus.
Bullish vs. Bearish Scenarios
Bullish Scenario
ASTER produces a sustained weekly close above $0.7305 — confirming the right-angled descending broadening wedge breakout. The cliff extension removes the anticipated monthly supply pressure, reducing overhead selling into the breakout. The pattern’s measured move target of $0.8621 becomes the primary objective — approximately +18% upside from the current price. In this scenario, the broader crypto bull environment (Bitcoin bear cycle declared over, Bull Score at 80) provides the macro tailwind that altcoin weekly breakouts require to sustain.
Bearish Scenario
The $0.7305 resistance holds — ASTER is rejected at the horizontal resistance line and pulls back toward the $0.66 support zone. The bullish wedge structure remains technically intact as long as $0.66 holds, allowing for a subsequent breakout attempt. However, a sustained close below $0.66 would weaken the wedge structure meaningfully and bring the $0.5989 wedge low back into focus as the next reference level.
Bottom Line
Aster is sitting at one of its most analytically defined moments since launch — testing the $0.7305 horizontal resistance of a right-angled descending broadening wedge on the same week the team extended the Team allocation cliff by 12 months, removing 10 million ASTER per month from the near-term vesting schedule for another year.
The technical setup is precise: a confirmed weekly close above $0.7305 targets $0.8621. The fundamental update is specific: 400 million tokens that were due to begin vesting this month will remain locked until September 17, 2027. Both are pointing in the same direction at the same price level.
$0.7305 is the line that resolves the setup — and the weekly close that confirms or rejects the breakout will determine whether ASTER’s current recovery from $0.5989 transitions into a measured move to $0.8621 or requires a deeper consolidation phase first.
Frequently Asked Questions
What is the Aster Team allocation cliff extension?
On September 1, 2026, Aster extended the cliff on its Team allocation by 12 months — from September 17, 2026 to September 17, 2027. The Team allocation consists of 400 million ASTER (5% of max supply), which had been fully locked since TGE. Under the original schedule, 10 million ASTER was set to begin vesting monthly from this month — that vesting is now delayed until September 2027.
How does the cliff extension affect ASTER’s supply dynamics?
The extension removes the anticipated 10 million ASTER monthly unlock from near-term circulation for the next 12 months — reducing supply pressure at a critical resistance test. The buyback-and-burn mechanism (which burns the Team allocation first) remains unchanged and continues reducing the existing float.
The opinions and market insights shared on CoinsProbe represent the views of individual authors based on prevailing market conditions at the time of publication. Cryptocurrency investments carry significant risk and volatility. Readers are encouraged to conduct their own research and seek professional financial advice before making investment decisions. CoinsProbe and its contributors do not accept responsibility for financial losses or decisions made based on published content.
CoinsProbe may publish sponsored articles, affiliate links, or promotional collaborations. All sponsored material is clearly labeled to maintain transparency with our audience. Our editorial decisions remain fully independent, and advertising partnerships do not influence reviews, rankings, or published opinions.
Since 2023, CoinsProbe has delivered reliable insights on cryptocurrency, blockchain, and digital assets. Our content is created by experienced researchers and analysts who follow strict editorial standards focused on accuracy, transparency, and credibility. Every article is carefully reviewed and verified using trusted sources and current market data. We provide unbiased analysis and timely updates covering everything from emerging crypto projects to major industry developments.