
- JASMY is trading at approximately $0.00494 — up 5.12% in 24 hours and 14.89% over 30 days — with a market cap of ~$244.39 million, sitting at the same technical stage that preceded its 1,568% rally in 2023–2024.
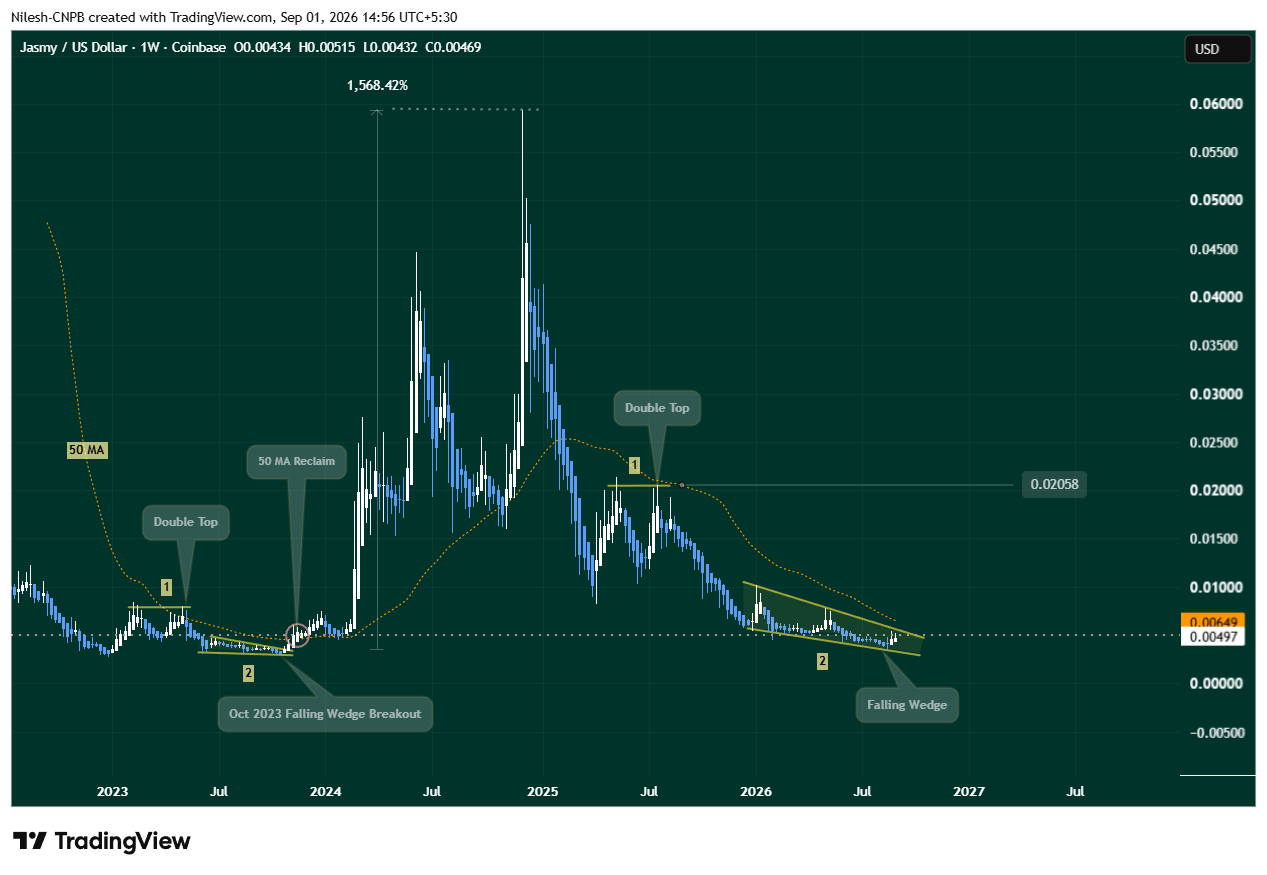
- The weekly chart shows JASMY repeating the October 2023 fractal exactly: double top → deep correction → falling wedge compression — with the wedge breakout at ~$0.0055 and 50-week MA at $0.00649 as the next two confirmation levels.
- A confirmed breakout and 50-week MA reclaim opens the path toward the first major target at $0.02058 — the prior double-top zone — representing more than 300% upside from current prices.
JasmyCoin (JASMY) is sitting at one of the most precisely defined technical setups it has produced this year — a weekly chart structure that is tracking the October 2023 pattern almost point-for-point, at the exact stage that preceded one of its most explosive rallies. The question the chart is asking is the same one it asked in late 2023: will the falling wedge break out and the 50-week MA be reclaimed?
At the time of writing, JASMY is trading at approximately $0.00494 — up 5.12% in 24 hours and 14.89% over 30 days — with a market capitalization of approximately $244.39 million. The broader crypto market recovery — Bitcoin reclaiming the 1,130-day SMA and CryptoQuant declaring the bear cycle over — is providing the macro tailwind. The chart is providing the pattern. The confirmation levels are specific and testable.

The October 2023 Jasmy’s Bullish Fractal
The analytical foundation of the current JASMY setup is a fractal comparison between the weekly chart structure forming now and the sequence that played out from October 2023 — a sequence that eventually produced a 1,568.42% rally from its wedge breakout lows to the subsequent peak.
The 2023 Sequence — Four Stages
The October 2023 fractal on JASMY’s weekly chart unfolded through a specific four-stage sequence:
Stage 1 — Double Top: JASMY formed a double top near a local high — the classical bearish reversal pattern where price makes two attempts at the same resistance level before rolling over into a sustained decline.
Stage 2 — Deep Correction into Falling Wedge: Following the double top, JASMY declined into a prolonged correction that compressed into a falling wedge pattern near the lows — two converging downward-sloping trendlines that build energy as price compresses toward the apex.
Stage 3 — Falling Wedge Breakout: In October 2023, JASMY broke out of the falling wedge — the technical signal that the compression phase was ending and a new directional move was beginning.
Stage 4 — 50-Week MA Reclaim: The breakout was confirmed by a sustained reclaim of the 50-week moving average — the long-term trend indicator that validated the structural shift from bearish to bullish. That reclaim was the point at which the 1,568.42% rally began accelerating.
The 2026 Sequence — Where JASMY Is Now
The current weekly chart is tracking the same four-stage sequence — with stages 1 and 2 already completed and stage 3 now in progress:
Stage 1 — Double Top at $0.02058: JASMY printed a double top near $0.02058 — visible on the weekly chart with both peaks labeled and the level marked as horizontal resistance. This double top triggered the prolonged decline that defined JASMY’s 2025–2026 corrective phase.
Stage 2 — Deep Correction into Falling Wedge: Following the $0.02058 double top, JASMY declined toward the ~$0.0033 low — a drop of approximately 84% from the double-top level. From that low, a falling wedge has been forming on the weekly chart — two converging downward-sloping trendlines compressing price into an apex, mirroring the exact structure from 2023.
Stage 3 — Falling Wedge Breakout (In Progress): Price has bounced off the falling wedge support trendline and recovered to the current level of ~$0.00494 — approaching the wedge’s upper boundary near $0.0055. The breakout has not yet been confirmed — a sustained weekly close above $0.0055 is the specific trigger.
Stage 4 — 50-Week MA Reclaim (Pending): The 50-week moving average sits at approximately $0.00649 — just above the wedge breakout level. In the 2023 fractal, reclaiming the 50-week MA was the confirmation that the breakout was valid and that the expansion phase was beginning. The same confirmation logic applies in 2026.
The Two-Stage Confirmation Sequence
The fractal’s confirmation is not a single event — it is a two-step sequence that the 2023 pattern also required before the full rally materialized:
Step 1 — Falling Wedge Breakout at ~$0.0055
A sustained weekly close above $0.0055 — the upper boundary of the current falling wedge — is the first confirmation that the compression phase is ending. At the current price of $0.00494, JASMY is approximately 11% below the breakout level.
The falling wedge structure on the weekly chart shows two clear touches of both the upper and lower trendlines — the minimum required for a valid wedge pattern. The current price action inside the wedge, combined with the bounce off the lower boundary, suggests the compression phase is in its later stages rather than its beginning.
Step 2 — 50-Week MA Reclaim at $0.00649
A sustained reclaim of the 50-week moving average at $0.00649 is the second and more definitive confirmation level. The 50-week MA is a long-term trend indicator — a sustained close above it signals that the weekly trend structure has shifted from bearish to constructive.
From the current price of $0.00494, reaching the 50-week MA at $0.00649 would represent approximately +31% upside — and it would confirm the fractal in the same way the 2023 MA reclaim confirmed that cycle’s expansion.
The 1,568% Precedent — What It Looked Like in Context
The 1,568.42% rally labeled on the weekly chart is annotated from the falling wedge breakout lows in late 2023 to JASMY’s subsequent peak in early 2025. The rally did not happen overnight — it unfolded over approximately 12–15 months from the wedge breakout through the cycle peak.
The fractal comparison is not projecting an identical 1,568% gain from the current setup. It is identifying that the structural sequence — double top → deep correction → falling wedge → breakout → 50-week MA reclaim — produced that outcome the last time it appeared on JASMY’s weekly chart. The first major target if the current fractal plays out is the $0.02058 prior double-top resistance level — still more than 300% above the current price — which represents the near-term structural objective before any discussion of higher targets becomes relevant.
Macro Context — Why the Setup Is Appearing Now
The JASMY fractal is not developing in isolation. The broader crypto market environment in which it is appearing is materially more constructive than the environment JASMY spent most of 2026 in:
- Bitcoin has reclaimed the 1,130-day SMA — a signal that has marked the end of every bear market in four consecutive cycles
- CryptoQuant has declared the Bitcoin bear cycle over with a Bull Score of 80
- August delivered $3.52 billion in Bitcoin ETF inflows — the strongest monthly institutional demand of 2026
- U.S. regulatory clarity is improving following Trump’s White House crypto summit
Smaller-cap altcoins like JASMY typically require a constructive macro environment for their technical setups to activate — the same pattern that is structurally forming on the chart needs a risk-on backdrop to generate the volume and momentum that produces the expansion phase. The current macro environment is the most favorable JASMY has had since the conditions that supported its 2023–2024 rally.
Bullish vs. Bearish Scenarios
Bullish Scenario
JASMY sustains its current momentum and produces a weekly close above $0.0055 — breaking the falling wedge and initiating the confirmation sequence. The 50-week MA at $0.00649 is reclaimed on a sustained basis in the following sessions — mirroring the October 2023 pattern’s step-by-step validation. In this scenario, the fractal’s first major target at $0.02058 — the prior double-top zone — becomes the primary medium-term objective, representing more than 300% upside from current prices. The broader macro tailwind (Bitcoin bull cycle beginning, improving regulatory environment) amplifies the move by providing the risk-on context that altcoin expansion phases require.
Bearish Scenario
JASMY’s current bounce fails to sustain above the falling wedge upper boundary — with a drop back below the $0.0033 falling-wedge support invalidating the October 2023 fractal entirely. This scenario would indicate that the wedge compression has not yet reached its apex and that the structure needs more time — or lower prices — before a genuine breakout can develop. The 2023 fractal comparison would be invalidated, and JASMY would revert to a broader downtrend framework without a clearly defined recovery structure.
Bottom Line
JasmyCoin’s weekly chart is presenting the same four-stage structural sequence that preceded its 1,568% rally in 2023–2024 — with two of the four stages already completed and the third now in progress. The double top at $0.02058 and the deep correction into a falling wedge have both played out. The falling wedge breakout at $0.0055 and the 50-week MA reclaim at $0.00649 are the two remaining confirmation levels.
At $0.00494, JASMY is approximately 11% below the breakout level and 31% below the 50-week MA. The fractal is promising but unconfirmed — and that specific distinction matters. The 2023 pattern only produced its full outcome after both confirmation steps were completed in sequence. The same threshold applies to the 2026 setup.
The pattern is in place. The macro environment is supportive. The confirmation levels are defined. Whether the fractal completes or fails will be answered at $0.0055 and $0.00649 in the sessions ahead.
Frequently Asked Questions
Will JASMY recover in 2026?
JASMY is showing an early recovery structure on the weekly chart, matching the October 2023 setup that preceded a major rally. A confirmed breakout above $0.0055 and a 50-week MA reclaim at $0.00649 would strengthen the recovery case.
Is JASMY good to accumulate in September 2026?
The current zone near $0.0049 sits after a bounce from falling-wedge support around $0.0033. Accumulation interest rises if price holds that support and breaks the wedge near $0.0055.
Can JASMY reach $0.02 again?
If the October 2023 fractal continues, the first major upside target is $0.02058 — more than 300% above the current price. That move would still need a wedge breakout and 50-week MA reclaim first.
The opinions and market insights shared on CoinsProbe represent the views of individual authors based on prevailing market conditions at the time of publication. Cryptocurrency investments carry significant risk and volatility. Readers are encouraged to conduct their own research and seek professional financial advice before making investment decisions. CoinsProbe and its contributors do not accept responsibility for financial losses or decisions made based on published content.
CoinsProbe may publish sponsored articles, affiliate links, or promotional collaborations. All sponsored material is clearly labeled to maintain transparency with our audience. Our editorial decisions remain fully independent, and advertising partnerships do not influence reviews, rankings, or published opinions.
Since 2023, CoinsProbe has delivered reliable insights on cryptocurrency, blockchain, and digital assets. Our content is created by experienced researchers and analysts who follow strict editorial standards focused on accuracy, transparency, and credibility. Every article is carefully reviewed and verified using trusted sources and current market data. We provide unbiased analysis and timely updates covering everything from emerging crypto projects to major industry developments.