
- BGB is trading near $1.68 as of August 12, 2026 — up 2.77% over 30 days but down 51.72% year-to-date — with a market cap of $1.17 billion.
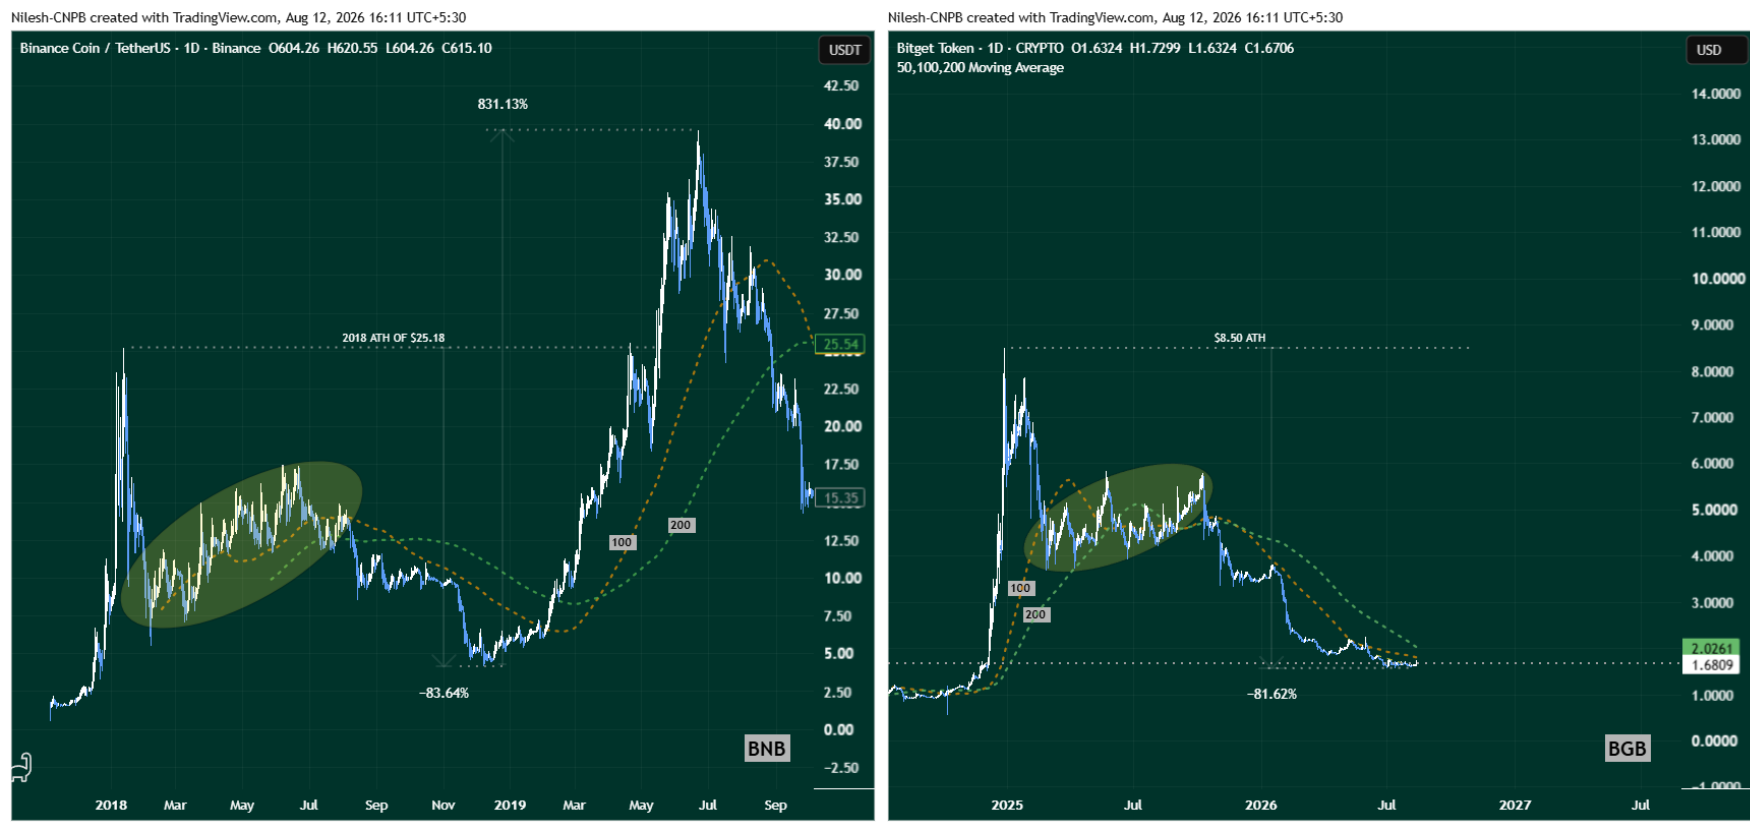
- BGB's current chart structure closely mirrors BNB's late 2018 bottoming pattern, which preceded an 800%+ rally after reclaiming its 100-day and 200-day moving averages.
- Bitget ranks 7th among all centralized exchanges globally with $5.10 billion in assets per DefiLlama — providing fundamental exchange-level support for the BGB recovery thesis.
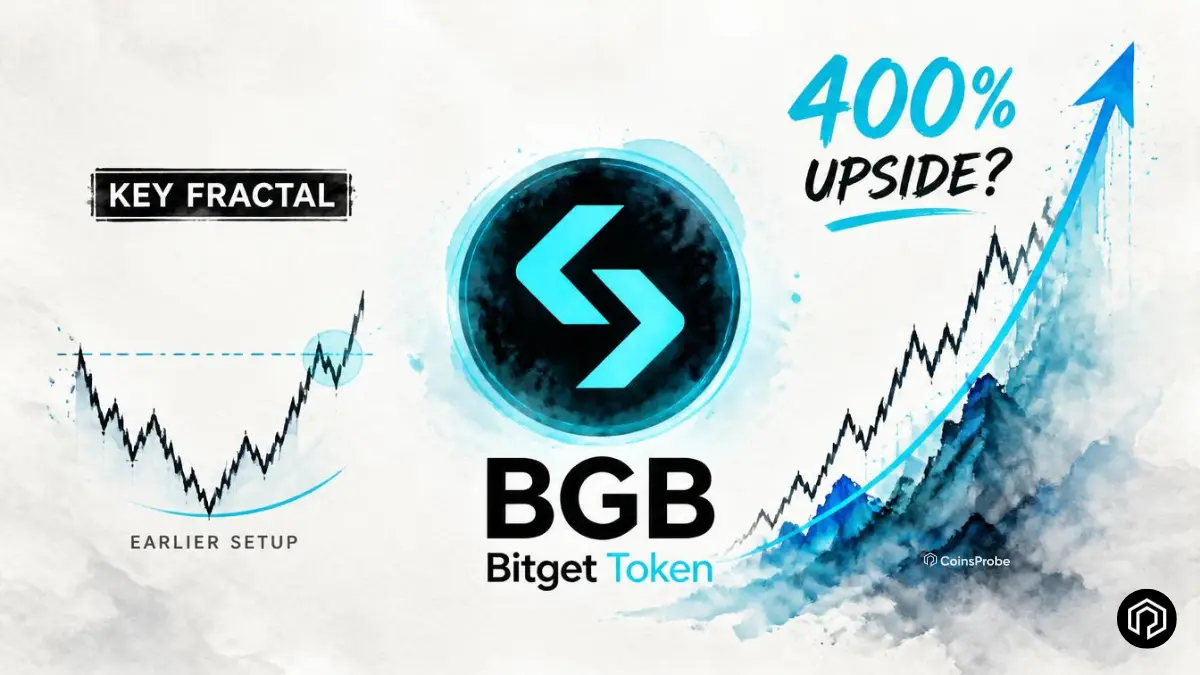
- If the BNB fractal plays out, BGB could target its previous all-time high near $8.50 — representing approximately 400% upside from current levels.
Bitget Token (BGB) has spent much of 2026 under heavy pressure — falling 51.72% year-to-date after declining 81.62% from its all-time high of $8.50. But the chart structure that has been forming during that decline is now drawing comparisons to one of the most well-documented recovery setups in exchange token history: Binance Coin’s 2018 bottoming cycle that preceded an 800%+ advance.
At the time of writing, BGB is trading at approximately $1.68 with a market capitalization of $1.17 billion — sitting almost exactly at the 100-day moving average, the first of two key technical levels that will determine whether the current consolidation transitions into a confirmed recovery or remains a prolonged base.

As covered in our BGB mirrors BNB bullish fractal analysis, the fractal comparison between BGB’s current structure and BNB’s 2018–2019 cycle has been developing for several months. The current price action is continuing to track that template with notable precision.
Bitget’s Exchange Fundamentals — 7th Largest CEX With $5.10B in Assets
Before examining the technical fractal, it is worth anchoring the BGB recovery thesis in the fundamental reality of the exchange behind the token.
According to DefiLlama data, Bitget currently ranks as the 7th largest centralized exchange globally with $5.10 billion in total assets — a figure that places it firmly in the upper tier of operational CEX infrastructure by any objective measure.
This matters for BGB specifically because exchange tokens derive a meaningful portion of their value from the operational health, user base, and asset custody scale of the platform they represent. An exchange with $5.10 billion in assets and a top-7 global ranking is not a speculative or early-stage operation — it is an established, functioning exchange with real institutional and retail user activity.
The contrast between Bitget’s fundamental standing ($5.10B assets, 7th globally) and BGB’s current market cap ($1.17 billion) and year-to-date price performance (-51.72%) creates the type of fundamental-to-price divergence that has historically been characteristic of recovery setups — where the underlying business remains strong while the token price has overcorrected during a broader market downturn.
BGB Mirrors BNB’s 2018 Bullish Fractal
The core of the current BGB thesis is a fractal comparison that has been tracking with increasing precision: BGB’s 2025–2026 price structure closely mirrors the pattern BNB printed in late 2018 before one of the most explosive exchange token recoveries in crypto history.
What BNB Did in 2018–2019
In the 2018 bear market, Binance Coin underwent a severe correction that shares several structural characteristics with BGB’s current situation:
- BNB declined more than 83% from its all-time high — entering a prolonged downtrend that tested the conviction of even the most committed holders
- The token lost both its 100-day and 200-day moving averages — confirming bearish trend structure on the most widely watched technical indicators
- Price stabilized in a consolidation range at the lows before the moving average reclaims began
- Once BNB reclaimed both major moving averages with conviction, it triggered a trend reversal that produced an 800%+ advance — one of the defining recovery moves of the 2019 cycle
How BGB Is Tracking the Same Template
After declining roughly 81.62% from its all-time high of $8.50, BGB broke below both major moving averages and entered a prolonged downtrend. However, the token has recently shown resilience, stabilizing in the $1.56–$1.65 range, where a potential bottoming structure is forming.
This consolidation phase, combined with the fractal similarity to BNB, suggests that BGB could be in the early stages of a larger reversal setup.
Bullish vs. Bearish Scenarios
Bullish Scenario
BGB holds the $1.56–$1.68 consolidation range, sustains daily closes above the 100-day MA at $1.79, and progressively builds toward a reclaim of the 200-day MA at $2.02. A sustained move above $2.02 confirms the fractal, signals structural trend reversal, and opens the path toward recovery targets with $8.50 as the longer-term objective — mirroring the +800% BNB advance that followed the same technical sequence. Bitget’s fundamental positioning as the 7th largest CEX with $5.10B in assets provides the platform-level support that differentiates this thesis from a purely speculative fractal trade.
Bearish Scenario
BGB fails to hold the $1.56 support floor — the lower boundary of the current consolidation range — on a sustained daily or weekly close. A break below $1.56 would break the base structure, weaken the BNB fractal comparison, and signal that sellers remain in control despite the consolidation. In this scenario, lower support levels come into focus and the moving average reclaim timeline extends significantly. The fundamental exchange backdrop (7th globally, $5.10B assets) remains intact, but provides insufficient near-term price support without the technical structure holding.
Bottom Line
Bitget Token is at a technically precise and historically grounded decision point. An 81.62% decline from the $8.50 all-time high that mirrors BNB’s 2018 pre-recovery structure, a consolidation base forming in the $1.56–$1.68 range, and a current price sitting almost exactly at the 100-day moving average — these are the ingredients of the BNB fractal setup that the market is now watching play out in real time.
The fundamental backdrop reinforces the technical thesis: Bitget’s ranking as the 7th largest centralized exchange globally with $5.10 billion in assets per DefiLlama means the platform behind the token is operationally sound — a meaningful distinction from exchange token recovery theses built on weaker fundamental foundations.
$1.79 (100-day MA) and $2.02 (200-day MA) are the two levels that will define BGB’s near-term trajectory. A sequential reclaim of both — in the same order BNB executed in 2018–2019 — is the specific sequence the fractal requires to confirm. How BGB handles these levels over the coming sessions will determine whether the 400% recovery thesis advances from fractal comparison to confirmed trend.
Frequently Asked Questions
Will Bitget Token (BGB) rise in 2026?
BGB is currently consolidating near $1.68 after an 81.62% decline from its all-time high, with a chart structure that closely resembles BNB’s 2018–2019 bottoming phase that later produced a major rally.
Is BGB a good investment right now?
BGB is showing a potential reversal setup similar to BNB’s historic recovery. It remains a high-volatility asset, and confirmation above key moving averages would strengthen the bullish case.
What is Bitget’s current exchange ranking?
According to DefiLlama data, Bitget currently ranks as the 7th largest centralized exchange globally with $5.10 billion in total assets — placing it firmly in the upper tier of operational CEX infrastructure worldwide.
The opinions and market insights shared on CoinsProbe represent the views of individual authors based on prevailing market conditions at the time of publication. Cryptocurrency investments carry significant risk and volatility. Readers are encouraged to conduct their own research and seek professional financial advice before making investment decisions. CoinsProbe and its contributors do not accept responsibility for financial losses or decisions made based on published content.
CoinsProbe may publish sponsored articles, affiliate links, or promotional collaborations. All sponsored material is clearly labeled to maintain transparency with our audience. Our editorial decisions remain fully independent, and advertising partnerships do not influence reviews, rankings, or published opinions.
Since 2023, CoinsProbe has delivered reliable insights on cryptocurrency, blockchain, and digital assets. Our content is created by experienced researchers and analysts who follow strict editorial standards focused on accuracy, transparency, and credibility. Every article is carefully reviewed and verified using trusted sources and current market data. We provide unbiased analysis and timely updates covering everything from emerging crypto projects to major industry developments.