
- ICP trades near $2.10, up 1.9% in 24 hours despite remaining down YTD.
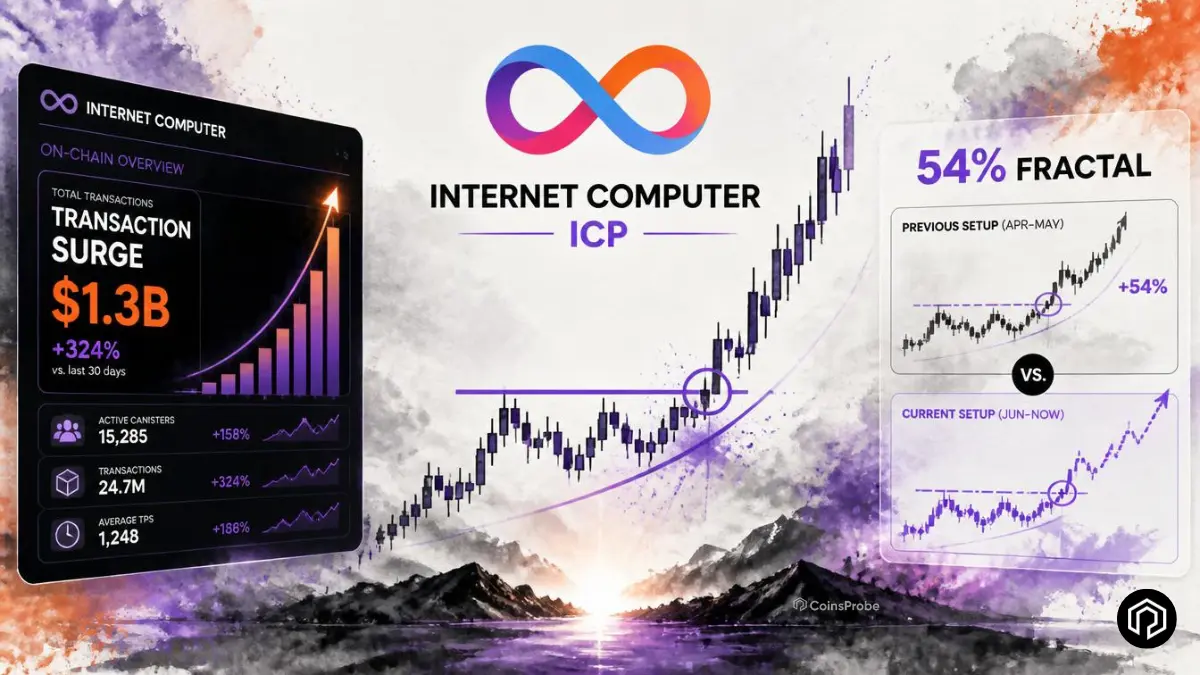
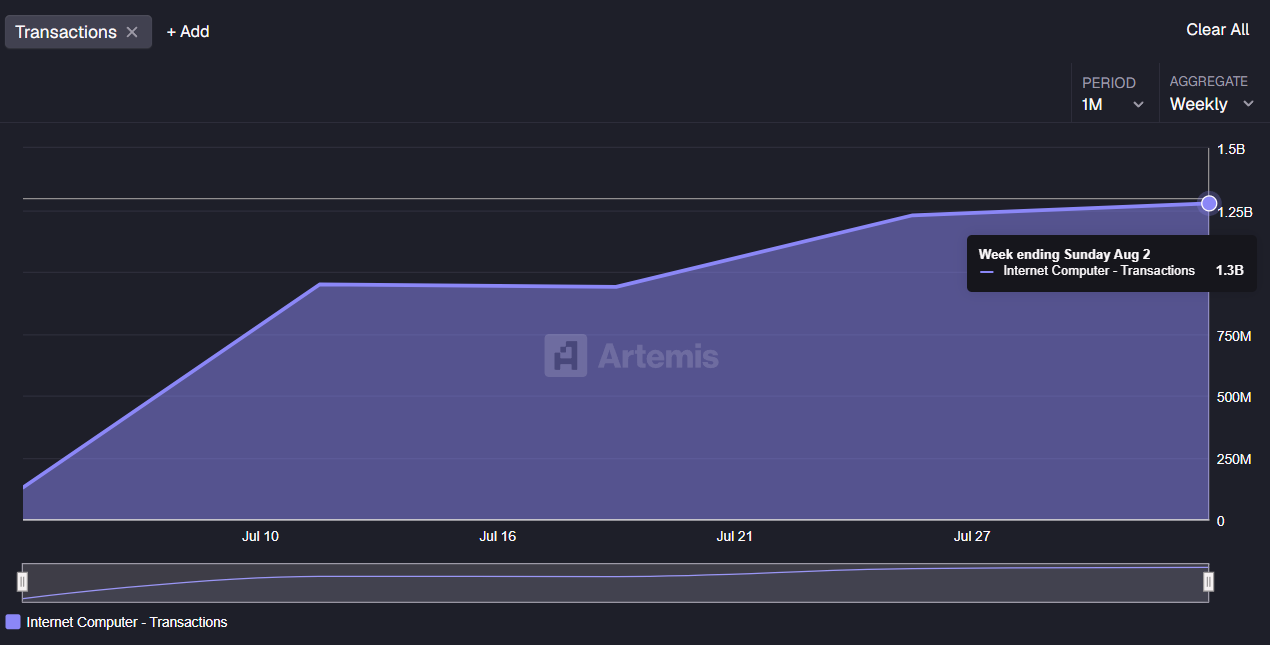
- Weekly transactions have surged over 900% since June, reaching 1.3 billion, signaling strong network growth.
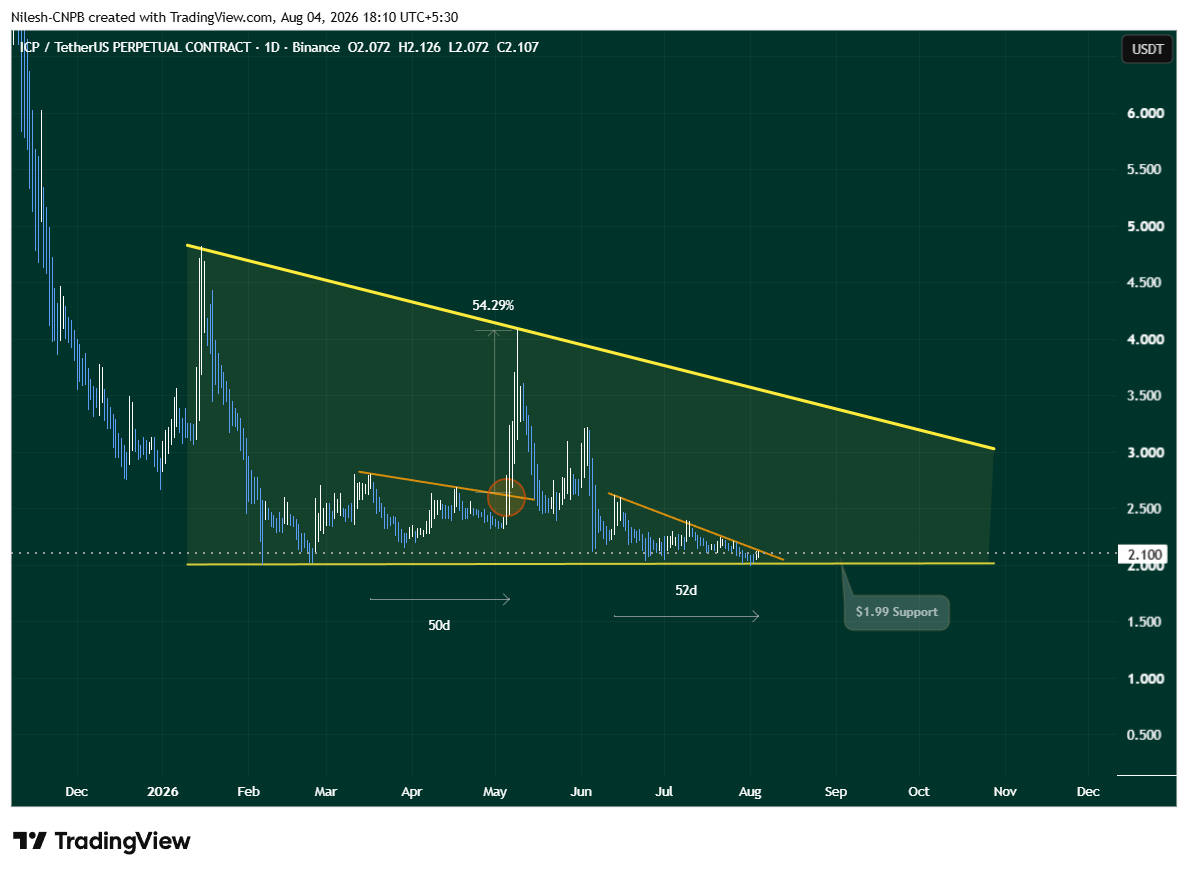
- ICP is forming a descending triangle, with a breakout above $2.15 targeting $3.31 (+55%).
- A drop below $1.99 would invalidate the bullish setup.
Internet Computer is presenting one of the most significant divergences between on-chain fundamental performance and price action in the current crypto market — weekly transactions growing from 128 million to 1.3 billion in eight weeks while price consolidates in a tight technical range. How that divergence resolves is the question the $2.15 resistance level will answer.
ICP is trading at $2.10 — up +1.93% in 24 hours, -3.43% over 30 days, and -25.94% year-to-date — with a market cap of approximately $1.16 billion. The modest daily gain and the tight consolidation range visible on the daily chart belie an on-chain activity profile that is growing at an extraordinary pace.

Weekly Transactions: 128 Million to 1.3 Billion in 8 Weeks
The on-chain metric that most demands attention for ICP right now is not subtle — it is one of the most dramatic weekly transaction growth trajectories visible in the current crypto market:
| Period | Weekly Transactions |
|---|---|
| Early June 2026 | ~128.3 million |
| Week ending August 2, 2026 | ~1.3 billion |
| Growth | +913% in ~8 weeks |
From 128.3 million to 1.3 billion weekly transactions in approximately eight weeks — a more than 10x increase in network usage in under two months — is not a gradual adoption curve. It is a step-change in network activity that reflects either a major new application gaining traction, a significant infrastructure improvement enabling new use cases, or a combination of both.
Why this matters for the price thesis:
ICP’s architecture — a high-throughput blockchain designed to run applications and store data at internet scale — means transaction volume directly reflects how much computational work the network is performing. A 10x increase in transactions represents 10x more applications running, 10x more user interactions, and 10x more demand for ICP as the network’s gas and staking token.
This is exactly the kind of on-chain growth that precedes price discovery — when the market eventually prices in the scale of network utilisation relative to the token’s current valuation. At $2.10 with a $1.16 billion market cap, a network processing 1.3 billion transactions per week is either significantly undervalued relative to comparable networks or the transaction growth needs to sustain and convert into fee demand to fully justify the repricing.
The growth trajectory — consistently stepping up week over week — suggests this is sustained adoption rather than a one-time spike.
Descending Triangle With a Constructive Historical Parallel
The daily chart is showing a descending triangle — a pattern that carries a default bearish interpretation but whose prior iteration on ICP’s own chart produced a significant bullish outcome.
Understanding the descending triangle:
A descending triangle is characterised by a flat lower horizontal support and a declining upper resistance trendline — where price makes lower highs while the support holds, creating a compression that must eventually resolve in one direction. The pattern is typically considered bearish because the progressively lower highs suggest sellers are becoming more aggressive relative to buyers — but it resolves upward more often than its bearish reputation suggests when supported by strong fundamentals.
ICP’s current triangle:
The flat support sits near $1.99 — the horizontal level that has held through multiple tests during the current consolidation phase. The declining upper resistance trendline has been capping every recovery attempt, with the near-term (mini) descending resistance now sitting near the $2.15 area.
The historical parallel — the prior 54% breakout:
The constructive element of ICP’s current setup is a direct historical precedent on the same chart. ICP previously spent approximately 50 days in a corrective phase inside a similar descending structure — before breaking higher for approximately a +54% move. The structural similarity between that prior consolidation and the current one provides a specific, documented reference point for what the bullish resolution of this pattern looks like on ICP specifically.
This is not a generic “descending triangles sometimes break upward” observation — it is a comparison to the same asset’s prior behaviour in an almost identical pattern, which adds meaningful credibility to the bullish scenario.
The $2.15 breakout trigger:
A sustained break and hold above the near-term resistance trendline near $2.15 — ideally confirmed with elevated volume — would signal that the descending triangle is resolving to the upside rather than the downside. This is the specific price event that activates the bullish scenario and puts the measured move target in play.
The $3.31 measured move target:
The pattern’s measured move — projecting the triangle’s height above the $2.15 breakout level — produces a target of approximately $3.31. From the current price of $2.10, reaching $3.31 represents approximately +55% upside — consistent with the prior breakout’s +54% move and reinforcing the historical parallel.
The $1.99 support floor:
The horizontal support near $1.99 is the level that must hold to maintain the descending triangle’s structure and keep the bullish scenario viable. A sustained daily close below $1.99 would confirm the triangle has resolved bearishly — validating the pattern’s default interpretation and opening the door to further downside without a clear support reference immediately below.
Bullish Scenario — Break Above $2.15, Target $3.31
ICP holds the $1.99 horizontal support — the declining upper resistance continues to compress price toward the apex — before a volume-confirmed break above $2.15 signals the bullish resolution. The measured move activates toward $3.31 (+55%), mirroring the prior +54% breakout from the same pattern type on the same chart. The 1.3 billion weekly transaction volume provides the fundamental justification for the repricing as the market catches up to on-chain usage growth.
Bearish Scenario — Below $1.99
A sustained daily close below $1.99 confirms the descending triangle has resolved bearishly — consistent with the pattern’s default interpretation. In this scenario, the horizontal support has been broken, the bullish thesis requires reassessment, and further downside pressure follows without a clear technical floor immediately visible below the $1.99 level.
Bottom Line
Internet Computer is running one of the more striking on-chain growth stories in the current market — weekly transactions growing from 128 million to 1.3 billion in eight weeks — while price consolidates in a descending triangle that previously resolved with a +54% breakout on the same chart. The $2.15 resistance trendline is the specific level that determines which version of this story plays out: the +55% measured move toward $3.31, or the triangle’s bearish resolution below $1.99 support.
Watch $2.15 for the breakout that activates the upside. Watch $1.99 for the breakdown that ends the near-term bullish case.
Frequently Asked Questions (FAQ)
What is driving ICP’s on-chain growth?
ICP weekly transactions grew from approximately 128.3 million in early June to 1.3 billion for the week ending August 2 — a +913% increase in approximately eight weeks — reflecting accelerating application usage on Internet Computer’s high-throughput infrastructure.
Is ICP currently a good investment for the remaining months of 2026?
It depends on your risk tolerance. ICP is a high-risk, high-reward bet. The network shows strong real usage (very high transaction volumes), improving tokenomics via “Mission 70” (lower inflation), and growing AI/ecosystem activity. However, the price has underperformed for years and remains near multi-year lows (~$2.10).
The opinions and market insights shared on CoinsProbe represent the views of individual authors based on prevailing market conditions at the time of publication. Cryptocurrency investments carry significant risk and volatility. Readers are encouraged to conduct their own research and seek professional financial advice before making investment decisions. CoinsProbe and its contributors do not accept responsibility for financial losses or decisions made based on published content.
CoinsProbe may publish sponsored articles, affiliate links, or promotional collaborations. All sponsored material is clearly labeled to maintain transparency with our audience. Our editorial decisions remain fully independent, and advertising partnerships do not influence reviews, rankings, or published opinions.
Since 2023, CoinsProbe has delivered reliable insights on cryptocurrency, blockchain, and digital assets. Our content is created by experienced researchers and analysts who follow strict editorial standards focused on accuracy, transparency, and credibility. Every article is carefully reviewed and verified using trusted sources and current market data. We provide unbiased analysis and timely updates covering everything from emerging crypto projects to major industry developments.