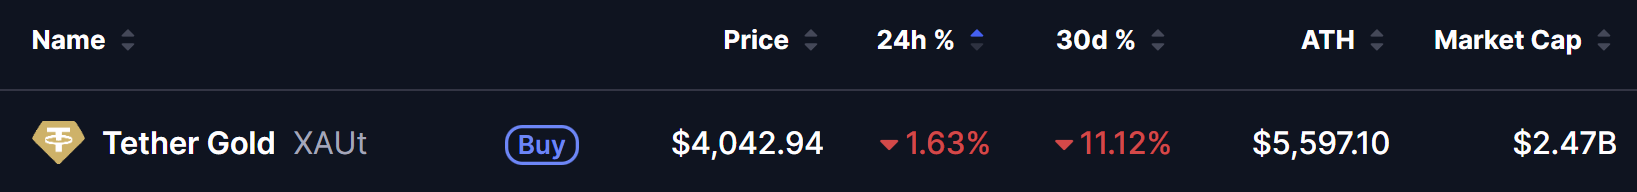
- Tether Gold (XAUt) is trading at $4,042.94 — down -1.63% in 24 hours and -11.12% over 30 days — with a market cap of $2.47 billion, well below its all-time high of $5,597.10.
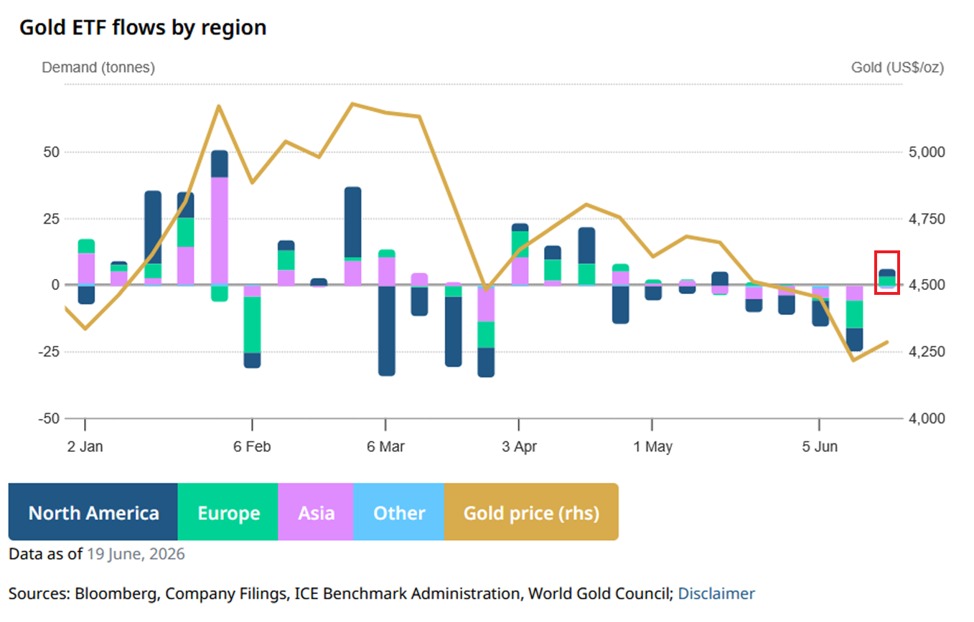
- Physical gold-backed ETFs recorded their largest weekly inflows since mid-April — adding +5.1 tonnes (+$1.1 billion) — reversing four consecutive weeks of outflows totalling -58.2 tonnes (-$7.6 billion).
- Total gold ETF holdings have recovered to 4,086.3 tonnes — roughly back to mid-January levels but still 22% below the all-time high of 4,176.1 tonnes set in late February.
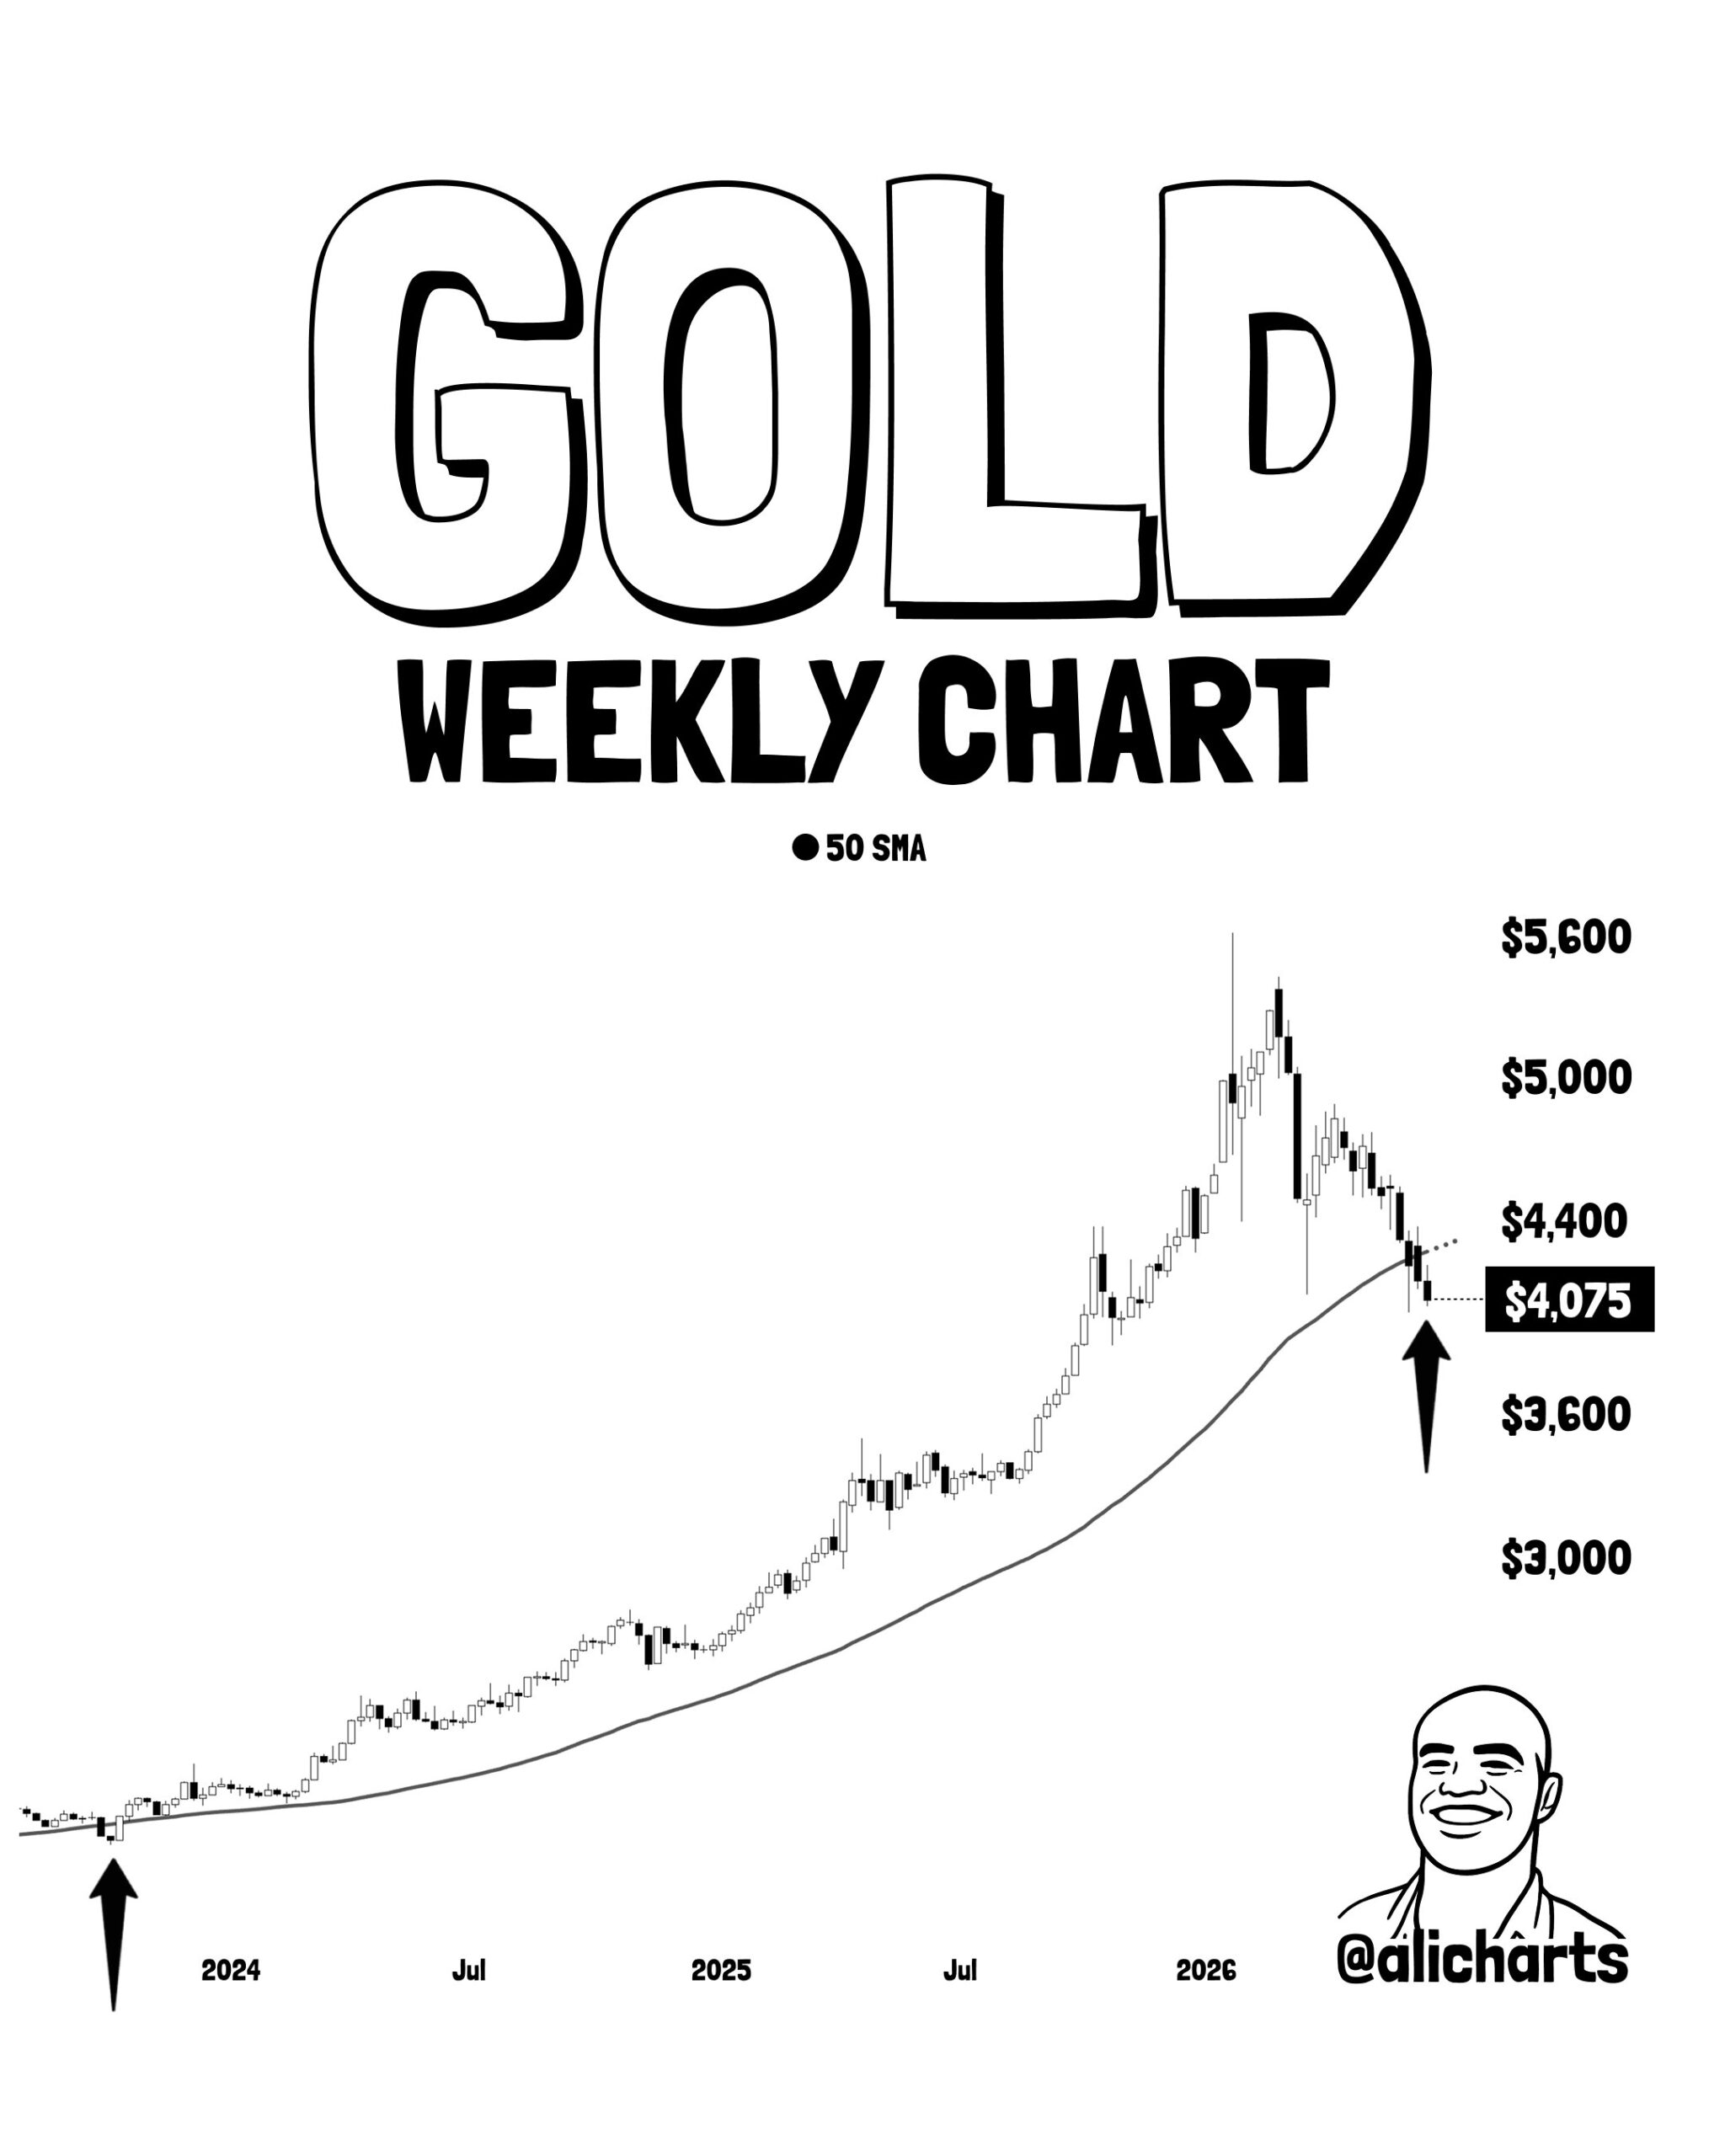
- Technical analyst Ali Charts notes gold is testing its 50-week SMA at $4,320 for the first time since September 2023 — a level whose last breach preceded a +190% rally from $1,932 to $5,602.
Gold is sitting at a genuinely interesting crossroads. Currently trading around $4,042.94 — a price level we’re referencing through Tether Gold (XAUt), the blockchain-native token that tracks physical gold directly — the metal is showing two independent signals pointing toward a potential turning point: a sharp return of institutional ETF demand, and a technical setup that has historically preceded one of gold’s most significant rallies.
Gold at a Glance — June 22, 2026
Institutional Gold Demand Is Returning — The ETF Data
According to market analyst The Kobeissi Letter, physical gold-backed ETFs just recorded their largest weekly inflows since mid-April — a meaningful reversal after a period of sustained selling.
The numbers:
| Metric | Data |
|---|---|
| Last week’s inflow | +5.1 tonnes |
| Dollar value | +$1.1 billion |
| Prior 4-week outflow streak | -58.2 tonnes |
| Dollar value of outflows | -$7.6 billion |
| Current total holdings | 4,086.3 tonnes |
| Distance from ATH (4,176.1 tonnes) | -22% |
The context here matters significantly. Before this week’s inflow — gold ETFs had endured four consecutive weeks of outflows totalling nearly $7.6 billion in withdrawn capital. A single week of +$1.1 billion in fresh inflows does not fully reverse that selling — but it represents the first genuine sign that the selling pressure may be exhausting itself.
Total gold ETF holdings now sit at 4,086.3 tonnes — which puts current holdings roughly in line with mid-January levels, even after the recent recovery. This remains 22% below the all-time high of 4,176.1 tonnes set in late February — a level that, at the time, was valued at approximately $701.7 billion.
Why this shift matters: This marks the first visible sign of recovery in Western institutional demand for gold after an extended period of heavy selling. ETF flows are one of the cleanest proxies available for tracking institutional and retail investor sentiment toward gold specifically — as opposed to central bank buying or other demand sources that move on different timelines and motivations.
The Technical Setup
While the ETF flow data provides the fundamental demand picture — technical analyst Ali Charts (@alicharts) has identified a chart-based signal that adds significant historical context to the current moment.
Gold is currently trading just below its 50-week Simple Moving Average (SMA) at $4,320 — and critically, this is the first time this specific level has been tested since September 2023.
Why September 2023 matters:
In September 2023, gold briefly dipped below this same 50-week SMA before reclaiming it — and that reclaim went on to trigger a massive +190% rally, taking gold from $1,932 to $5,602 over the subsequent period. This is the single largest sustained gold rally referenced in the current analysis, and it began from almost exactly the kind of technical setup gold is displaying right now.
The current significance: Ali Charts’ framing is that a clean weekly close above $4,320 could function as a strong bullish confirmation signal — potentially marking the start of a new leg higher, similar in character to what followed the 2023 reclaim, even if not necessarily identical in magnitude.
The $3,900–$4,000 zone has functioned as recent support — and as long as that level continues to hold, the broader structure remains intact for a potential push back toward and above the $4,320 50-week SMA. A clean weekly close above that level is the specific confirmation Ali Charts’ analysis is watching for.
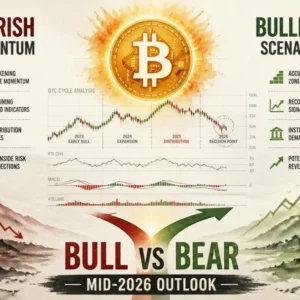
Two Scenarios for Gold
Bullish Scenario — Reclaim of $4,320
A sustained weekly close above the 50-week SMA at $4,320 — combined with continued ETF inflows building on this week’s reversal — would mirror the technical and fundamental conditions that preceded the 2023 rally. If institutional demand continues returning at a pace similar to or exceeding this week’s +$1.1 billion, gold could begin a genuine recovery trajectory back toward its all-time high.
Bearish Scenario — Failure at $4,320 and Loss of Support
If gold fails to reclaim the 50-week SMA and instead breaks below the $3,900–$4,000 support zone, the technical structure weakens significantly — and a resumption of the prior four-week ETF outflow trend would compound that pressure, potentially extending the current correction further.
Bottom Line
Gold is showing its first genuine signs of stabilisation after a difficult stretch. Institutional ETF investors just returned with the largest weekly inflow since mid-April — a meaningful reversal after four consecutive weeks of heavy outflows. Simultaneously, gold is testing a 50-week moving average level it has not approached since September 2023 — the last time it touched this level before launching a +190% rally.
Neither signal guarantees a repeat of history. But the combination of returning institutional demand and a historically significant technical level being tested simultaneously is the kind of setup worth watching closely. A clean weekly close above $4,320 would be the clearest confirmation that this recovery has genuine momentum behind it.
Frequently Asked Questions
What happened with gold ETF inflows this week?
Physical gold-backed ETFs recorded their largest weekly inflows since mid-April — adding +5.1 tonnes (+$1.1 billion) — reversing four consecutive weeks of outflows totalling -58.2 tonnes.
Why is the $4,320 level significant for gold?
It is gold’s 50-week Simple Moving Average — currently being tested for the first time since September 2023, when a similar reclaim preceded a +190% rally from $1,932 to $5,602.
What are the latest gold ETF inflows?
Physical gold ETFs recorded +5.1 tonnes of inflows last week (+$1.1 billion), marking the largest weekly inflow since mid-April after four straight weeks of heavy outflows.
What is the significance of the 50-week SMA for gold?
It has historically acted as a strong support/resistance level. A decisive weekly close above $4,320 could signal the start of a new bullish leg.
The opinions and market insights shared on CoinsProbe represent the views of individual authors based on prevailing market conditions at the time of publication. Cryptocurrency investments carry significant risk and volatility. Readers are encouraged to conduct their own research and seek professional financial advice before making investment decisions. CoinsProbe and its contributors do not accept responsibility for financial losses or decisions made based on published content.
CoinsProbe may publish sponsored articles, affiliate links, or promotional collaborations. All sponsored material is clearly labeled to maintain transparency with our audience. Our editorial decisions remain fully independent, and advertising partnerships do not influence reviews, rankings, or published opinions.
Since 2023, CoinsProbe has delivered reliable insights on cryptocurrency, blockchain, and digital assets. Our content is created by experienced researchers and analysts who follow strict editorial standards focused on accuracy, transparency, and credibility. Every article is carefully reviewed and verified using trusted sources and current market data. We provide unbiased analysis and timely updates covering everything from emerging crypto projects to major industry developments.