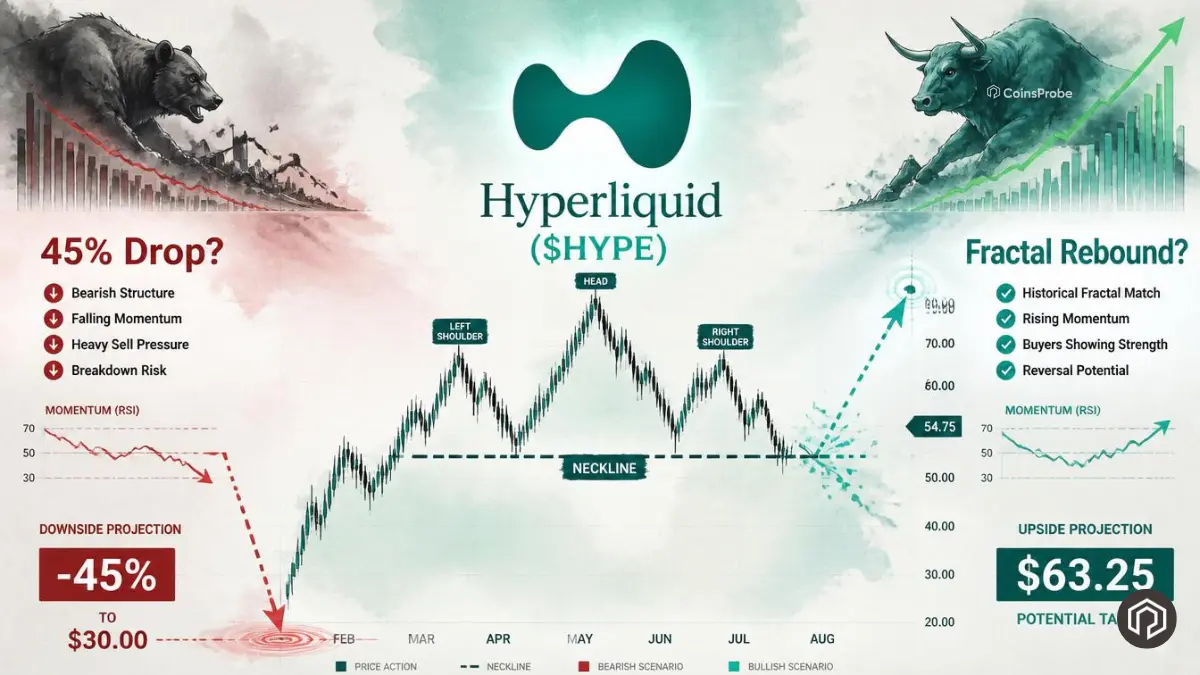

- HYPE has dropped over 22% in the past week and more than 10% today alone, falling from its all-time high of $75.79
- A classic Head and Shoulders pattern has formed on the daily chart, with the neckline sitting at the critical $54–$55 zone
- A Chainlink (LINK) fractal from January 2025 — overlaid on the current HYPE chart — shows a near-identical setup that ended in a strong bear trap and rebound rather than a breakdown
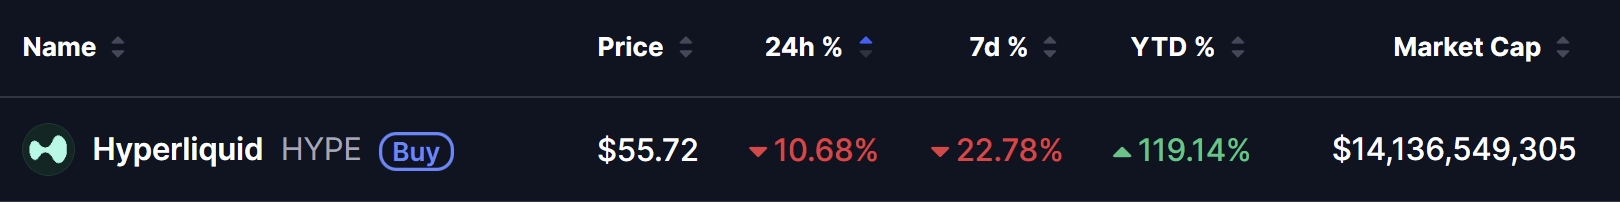
Hyperliquid’s native token HYPE has been under significant selling pressure over the past few weeks. Since hitting its all-time high of $75.79, the token has failed to sustain momentum and is now trading around $55.67 — reflecting a weekly decline of 22.78% and a jaw-dropping 10.68% drop on the day alone.
The sharp correction is not entirely surprising given the broader market environment, but what has traders and analysts paying close attention right now is the chart structure. A textbook bearish Head and Shoulders pattern has emerged on the daily timeframe, and the price is now sitting dangerously close to the neckline — the level that will define HYPE’s next major directional move.
Yet, it is not all doom and gloom. An intriguing fractal has emerged from Chainlink’s (LINK) January 2025 price action, which followed an almost identical pattern before staging a powerful recovery that caught bears completely off guard. The next few days could be decisive.
It is worth noting that HYPE has been one of the standout performers of 2026, still sitting on +119.14% year-to-date gains despite the recent weakness — a reminder of the underlying strength this asset has demonstrated. As covered earlier this year, HYPE hit a new ATH with the strongest spot crypto ETF debut in history, underscoring just how far this token has come in a short period.
The LINK Fractal — History May Be Repeating Itself
Perhaps the most compelling part of the current HYPE setup is the yellow overlay visible on the chart — the price action of Chainlink (LINK) from January 2025.
In late 2024, Chainlink formed a very similar Head and Shoulders pattern on its daily chart. The setup had all the hallmarks of an impending breakdown — a clear head, defined left and right shoulders, and a neckline that the market was leaning heavily on. The bears appeared to be in full control.
But instead of collapsing below the neckline, LINK held firm, aggressively defended the support zone, and launched a powerful rebound in 2025 that squeezed out short positions and trapped bears who had prematurely positioned for a breakdown.
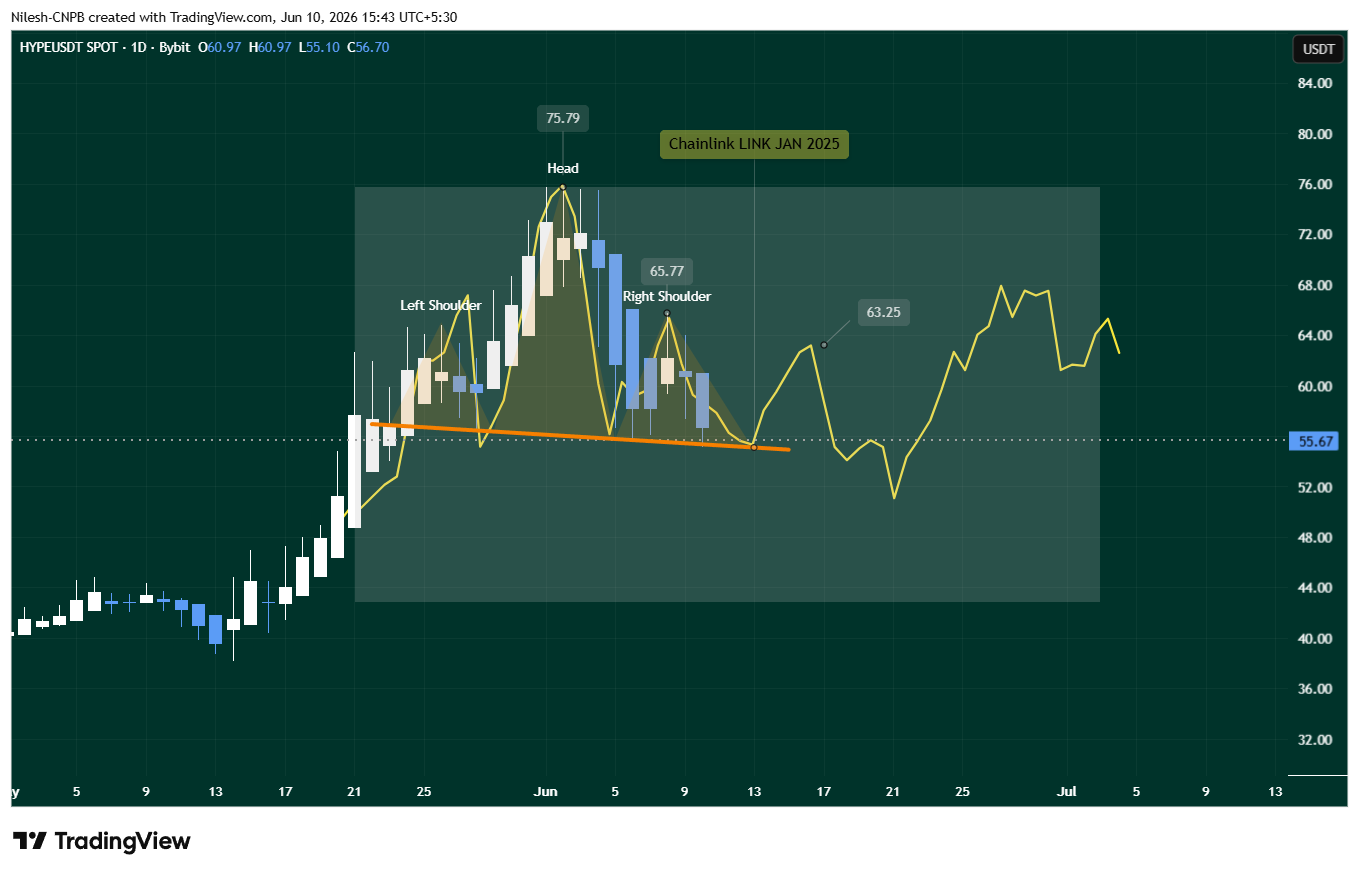
On the current HYPE daily chart, the fractal alignment is striking:
- Head: $75.79 (all-time high)
- Left Shoulder: Formed at $64.79
- Right Shoulder Top: $65.77, with price pushed back down immediately after
- Neckline: $54–$55 zone — now being tested in real time
The yellow LINK fractal overlay suggests that if HYPE follows the same script, the neckline holds and a recovery begins from this very zone. This is not a guarantee — fractals are probabilistic, not deterministic — but the structural similarity is hard to ignore for traders looking at pattern-based setups.
This fractal-based approach to analysis is something CoinsProbe analysts have been developing for multiple assets. Earlier, the same methodology flagged important setups on ICE CEO calling Hyperliquid bigger than Nasdaq as HIP-3 open interest hit a new ATH — demonstrating the growing institutional attention on this ecosystem.
Bullish vs Bearish Scenarios — What Happens Next?
Bullish Scenario — Fractal Holds, Bears Get Trapped
If the LINK fractal continues to play out on HYPE, the critical condition is a strong defence of the $54–$55 neckline. Bulls need to step in decisively at this level — ideally with a daily close well above $55 — and reject any breakdown attempt.
Should that happen, the fractal-based price target points toward $63.25, which represents a potential +14% recovery move from current levels around $55.67. This level also aligns with the right shoulder high area, which would confirm a failed pattern and a classic bull trap for those who shorted the breakdown.
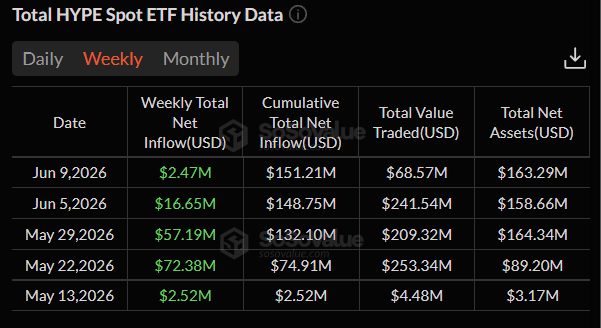
HYPE Spot ETF Strong Inflow
Supporting this scenario is the HYPE Spot ETF flow data. Despite the price weakness, the ETF recorded $2.47M in net inflows for the week of June 9, 2026, and cumulative net inflows have now crossed $151.21M. Sustained institutional buying through the ETF at lower prices suggests smart money may be viewing this dip as an opportunity rather than a warning sign.
Additionally, it is worth remembering that not everyone is bearish on HYPE even at these levels. Earlier, Grayscale’s HYPG ETF debuted amid record inflows as HYPE defied a brutal market crash — showing that institutional demand for HYPE exposure remains structural, not just speculative.
Bearish Scenario — Neckline Breaks, $30 Comes Into View
The bearish case is equally clear and arguably the more dangerous outcome. If HYPE fails to hold the $54–$55 neckline and closes decisively below it on the daily chart, the entire LINK fractal gets invalidated.
In that scenario, the Head and Shoulders pattern confirms as a genuine breakdown. Technical analysis convention measures the projected downside of a Head and Shoulders by taking the distance from the head to the neckline and projecting it downward from the breakdown point. That calculation puts a bearish target near $30 — approximately 45% below current levels.
This scenario also has a fundamental catalyst to watch. As reported on CoinsProbe, Arthur Hayes dumped an $18M HYPE position just days after calling a $150 target — a move that rattled sentiment significantly and may be contributing to the current selling pressure. Large holders exiting positions adds real selling pressure to technical breakdown risks.
A clean breakdown below $54 would likely accelerate selling as stop losses are triggered and leveraged longs get liquidated — a scenario HYPE has experienced before during sharp corrections.
Bottom Line
HYPE is at a genuine crossroads. The Head and Shoulders pattern is real, the neckline at $54–$55 is being tested right now, and the next few daily candles could define the token’s trajectory for weeks to come.
The LINK fractal offers a credible bullish counter-narrative — one that has already played out once in recent memory and cannot be dismissed. But fractals are not guarantees, and a clean breakdown below $54 with strong volume would be a serious technical warning that the bearish case is winning.
For bulls, the play is simple: hold $54–$55, reclaim $58, and target $63.25. For bears, a daily close below $54 is the confirmation they need before the $30 target comes into meaningful focus.
One thing is certain — sitting on the fence at this level is the riskiest position of all. The market is about to make a decision on HYPE, and traders should be prepared for a sharp move in either direction.
Frequently Asked Questions (FAQ)
What is the Head and Shoulders pattern on HYPE?
It is a classic bearish reversal pattern where the price forms three peaks — a higher middle peak (the head) flanked by two lower peaks (the shoulders). The neckline connecting the troughs between these peaks is the critical support level. A break below it signals a potential significant decline.
What is the LINK fractal and why does it matter for HYPE?
The LINK fractal refers to the price action Chainlink followed in late 2024 and early 2025, when it formed a near-identical Head and Shoulders structure but instead of breaking down, it rebounded strongly. Analysts are overlaying this pattern on HYPE’s current chart as a bullish alternative scenario.
The opinions and market insights shared on CoinsProbe represent the views of individual authors based on prevailing market conditions at the time of publication. Cryptocurrency investments carry significant risk and volatility. Readers are encouraged to conduct their own research and seek professional financial advice before making investment decisions. CoinsProbe and its contributors do not accept responsibility for financial losses or decisions made based on published content.
CoinsProbe may publish sponsored articles, affiliate links, or promotional collaborations. All sponsored material is clearly labeled to maintain transparency with our audience. Our editorial decisions remain fully independent, and advertising partnerships do not influence reviews, rankings, or published opinions.
Since 2023, CoinsProbe has delivered reliable insights on cryptocurrency, blockchain, and digital assets. Our content is created by experienced researchers and analysts who follow strict editorial standards focused on accuracy, transparency, and credibility. Every article is carefully reviewed and verified using trusted sources and current market data. We provide unbiased analysis and timely updates covering everything from emerging crypto projects to major industry developments.