
- Bitcoin has recovered to $77,344 — up +0.97% in 24 hours — with a market cap of approximately $1.55 trillion after testing the $74,000 zone on May 23.
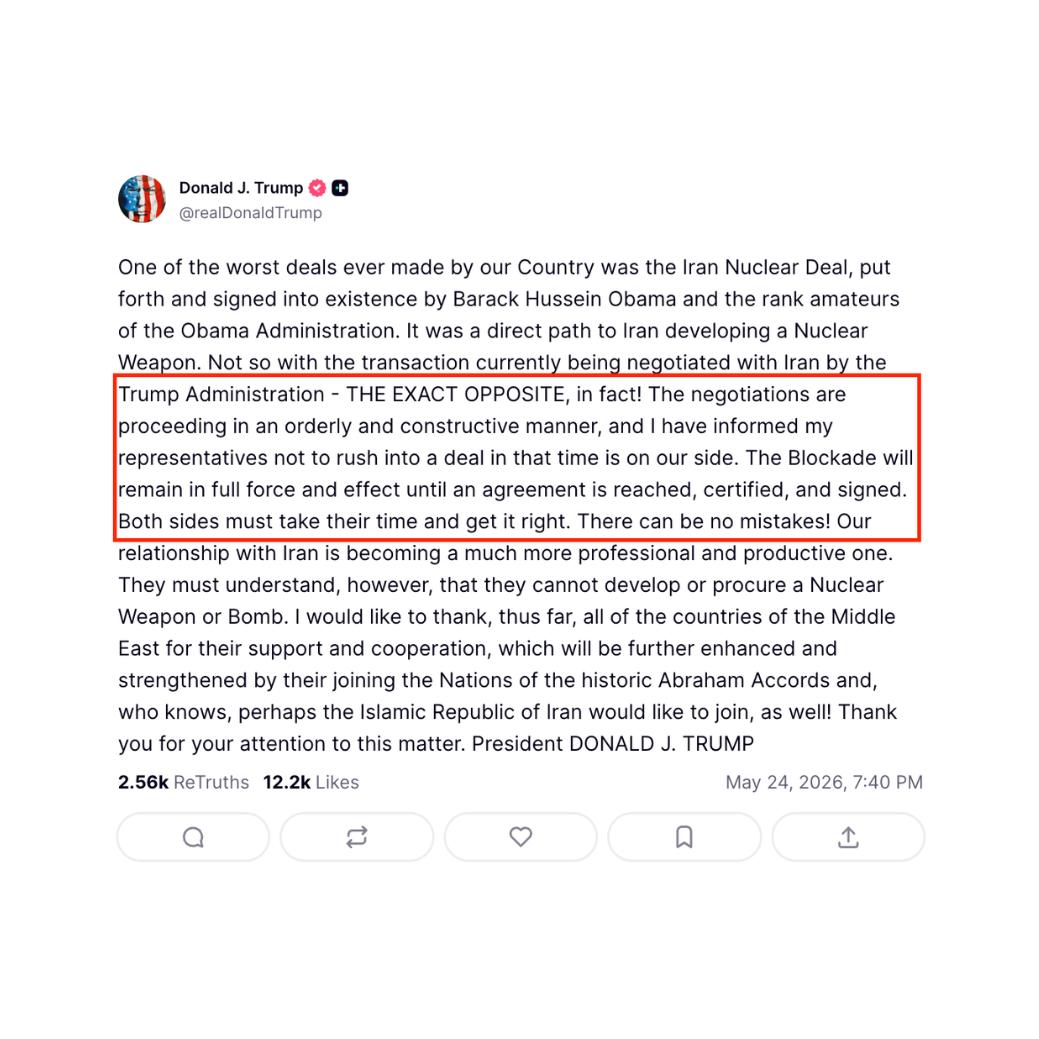
- The relief rally is driven by US-Iran de-escalation — President Trump stating a framework agreement has been "largely negotiated" — with the Strait of Hormuz set to reopen immediately under the emerging memorandum of understanding.
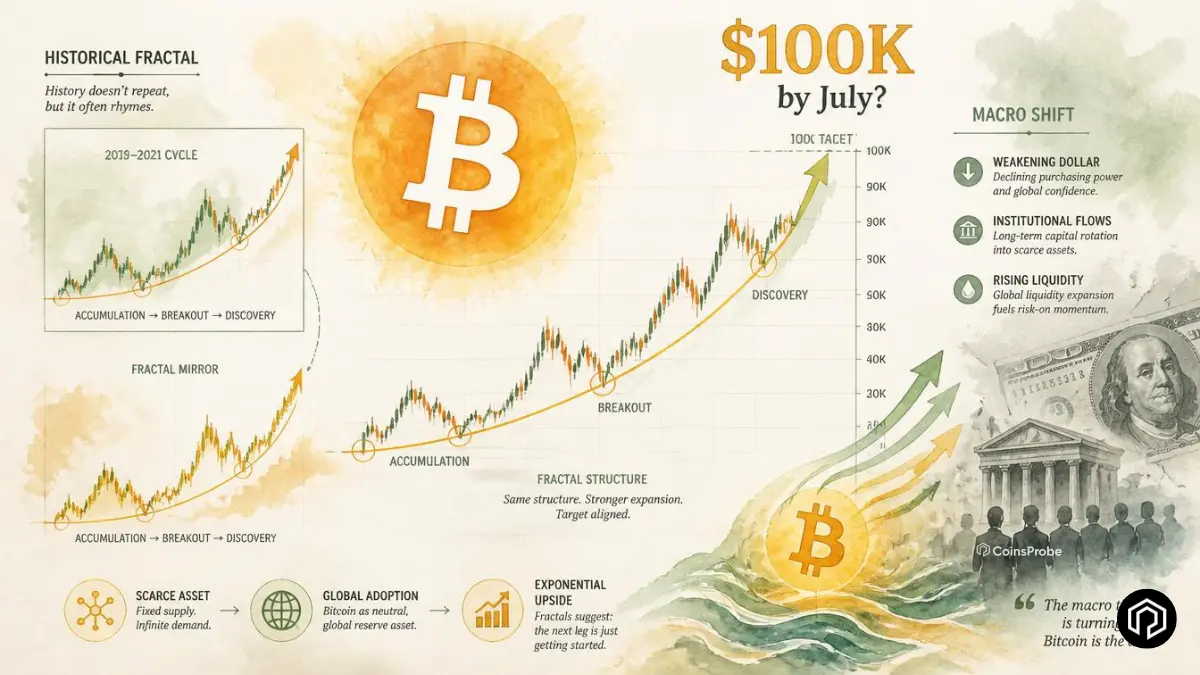
- Analyst @i_am_jackis identified the $74,500 drop as a textbook bullish weekly retest of the 2025 macro range low — not a breakdown — and has flipped to long with a $100K+ target by July–August.
- Bitcoin spot ETF cumulative net inflows remain strongly positive at approximately $57–58 billion — with total ETF net assets between $98.87 billion and $106.61 billion — despite short-term weekly outflows in May.
Bitcoin has opened the new trading week with a clear directional statement — bouncing sharply from the $74,000 area back above $77,344 as the geopolitical catalyst that triggered last week’s crash begins to reverse.

As we covered in our Bitcoin crash analysis and our Iran nuclear deadlock article, the dual catalyst of US-Iran escalation and the SEC’s tokenized stock delay sent BTC to $74,654 and liquidated $869 million in leveraged longs on May 23. The speed of this week’s recovery suggests the market was positioned for exactly this kind of geopolitical reversal.
Why Bitcoin Is Recovering — US-Iran De-escalation
The primary driver of this week’s recovery is the same force that caused last week’s decline — geopolitical developments between the United States and Iran. The dynamic has now reversed significantly.
President Trump has publicly stated that a framework agreement with Iran has been “largely negotiated” — and could be announced shortly. The emerging memorandum of understanding includes a critical provision: the immediate reopening of the Strait of Hormuz — the narrow waterway through which approximately 20% of global oil supply passes.
This single development has transformed the geopolitical risk calculus dramatically. When the Strait is threatened, oil prices spike, inflation fears intensify, and risk assets sell off. When the Strait is confirmed open — backed by a formal agreement — the entire sequence reverses. Oil prices ease, inflation anxiety subsides, and risk appetite returns to assets that were previously sold on fear rather than fundamentals.
For Bitcoin specifically — which sold off on geopolitical risk-off sentiment rather than any crypto-specific deterioration — the removal of that catalyst creates the conditions for a sharp recovery. The bounce from $74,000 to $77,344 in the opening hours of the new week is that recovery beginning.
Bitcoin ETF Flows — Mixed Weekly but Cumulatively Dominant
Bitcoin spot ETF data for May 2026 presents a nuanced picture that is important to read correctly:
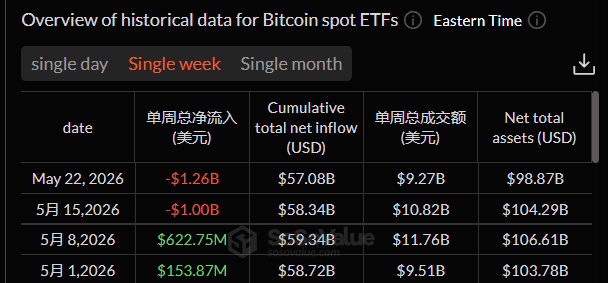
The weekly outflows on May 15 and May 22 reflect the same macro concerns — hot CPI data, US-Iran escalation, and the SEC tokenized stock delay — that pushed BTC to $74,000. Institutional ETF holders were reducing risk into macro uncertainty, not abandoning the Bitcoin thesis.
The cumulative picture tells a fundamentally different story:
- Total cumulative net inflows: ~$57–58 billion
- Total ETF net assets: $98.87 billion – $106.61 billion
These figures confirm that institutional demand for Bitcoin through regulated ETF products remains structurally intact. The May outflows represent short-term tactical de-risking — not a reversal of the long-term institutional allocation trend that has been building since the January 2024 ETF approvals.
The question as the final week of May begins: whether the US-Iran de-escalation and recovering risk sentiment can flip the ETF flows back to positive — and whether May closes green or red on the weekly candle.
Technical Analysis — The Bullish Fractal That Called the $74K Low
The most compelling technical development of the past week is not the bounce itself — it is the fractal that @i_am_jackis identified that predicted the $74,500 test before it happened.
The analyst shared the following assessment on X:
“This was a fractal that I was sharing about two weeks ago… as we were losing the 80K support, we should be seeing a retest of 2025 Yearly lows at 74.5K… this situation has already unfolded in the past… After the capitulation, there was no ‘sweep of the low’ anymore and instead we continue to slowly reclaim one level after another.”
Understanding the fractal:
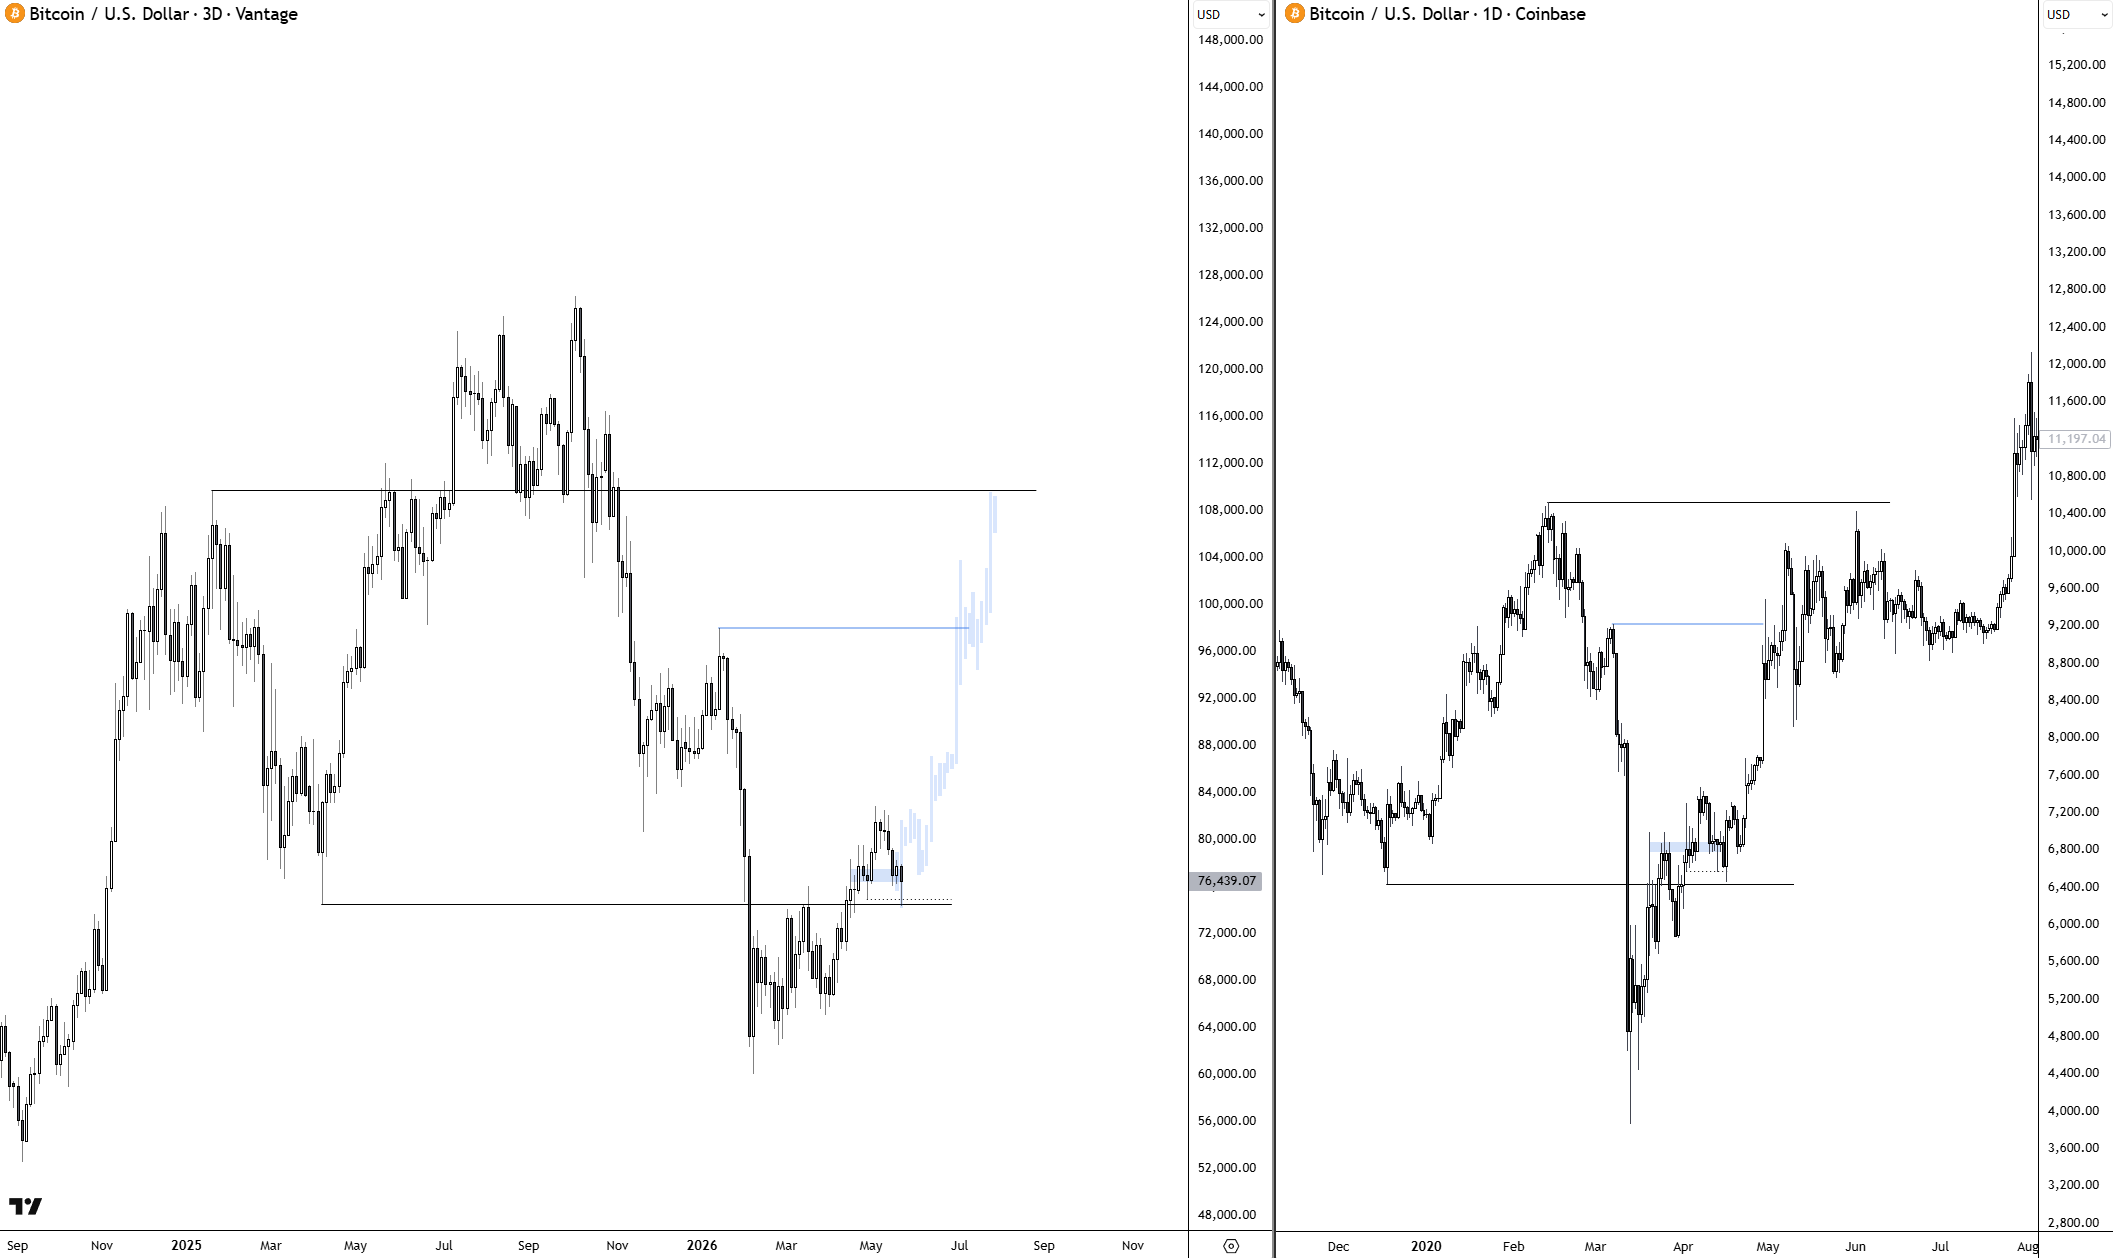
The side-by-side chart comparison tells the story visually. The left chart — BTC/USD on the 3-day timeframe — shows the current 2025–2026 cycle. The right chart shows a prior historical cycle for comparison. Both display the same structural sequence:
The pattern that played out:
A significant ATH — followed by a sharp correction into a defined macro range — a bounce attempt — a failed reclaim — a deeper retest of the macro range low — and then a recovery that builds higher lows progressively rather than sweeping to new lows.
In the current cycle, the 2025 yearly lows at $74,500 represented exactly this macro range low retest. When BTC lost $80,000 and dropped to $74,654 last week — the fractal was completing its expected structure. The key insight from @i_am_jackis is that after a capitulation of this nature in the fractal, the low is not swept again — instead price begins the slow grind of reclaiming levels one by one.
The current price at $76,439 — visible on the chart — marks the beginning of that reclaim sequence. Each level recovered above the $74,500 base is a higher low being established in the fractal structure.
The projection: If the historical fractal continues to track, the analyst sees a path toward $100,000+ by July–August 2026 — a recovery that mirrors the prior cycle’s post-capitulation expansion phase visible on the right side of the chart.
Invalidation level: A decisive weekly close below the 2025 macro range low — the $74,500 zone — would signal the fractal has broken down and a deeper correction is required before the recovery can resume.
What’s Next for Bitcoin — Two Scenarios
Bullish Scenario
US-Iran peace framework is formally announced — Strait of Hormuz reopens — oil prices ease and risk appetite returns across global markets. Bitcoin ETF flows flip back to positive in the final week of May. BTC builds on the $74,500 higher low — reclaiming $80,000 first as the key psychological level — then targeting the 200-day MA at $82,333 as the first major technical confirmation. Above the 200 MA the fractal projects continuation toward $100,000+ by July–August.
Bearish Scenario
US-Iran talks collapse — geopolitical risk returns — oil spikes back above $100 and risk-off sentiment resumes. ETF outflows continue through the final week of May. BTC fails to hold above $76,439 and tests the $74,500 level again. A weekly close below $74,500 invalidates the fractal — opening the path toward the weekly 200 MA around $68,879 as the next meaningful support.
Bottom Line
Bitcoin’s recovery above $77,000 to open the new trading week is being driven by the same force that caused last week’s crash — geopolitical developments — now moving in the opposite direction. US-Iran de-escalation and Strait of Hormuz reopening remove the primary macro risk that triggered $941 million in liquidations and sent BTC to $74,654.
The technical picture reinforces the recovery case. The @i_am_jackis fractal — which correctly called the $74,500 retest two weeks before it happened — identifies the current bounce as the beginning of a progressive higher-low reclaim sequence that historically leads to the next major expansion phase. The $74,500 macro range low held. The fractal is intact. The path of least resistance, as the analyst notes, is now higher.
Watch $80,000 as the first confirmation. Watch $82,333 as the 200 MA trigger. And watch the US-Iran headlines — because in this market, geopolitics is moving faster than technicals.
Frequently Asked Questions (FAQ)
Why is Bitcoin recovering this week?
Bitcoin is rebounding as geopolitical tensions between the US and Iran ease. Markets reacted positively after reports that negotiations had progressed and the Strait of Hormuz would reopen, reducing global risk sentiment.
What is the bullish Bitcoin fractal identified by analysts?
The fractal shows BTC retesting the $74,500 macro support zone before beginning a higher-low recovery structure — similar to previous Bitcoin market cycles that later led to strong upside expansion.
What level would invalidate the bullish setup?
A sustained weekly close below $74,500 would weaken the bullish fractal and could open the door to a deeper correction toward the weekly 200 MA near $68,879.
What do Bitcoin ETF flows show right now?
ETF flows turned mixed in May due to macro uncertainty, but overall cumulative inflows remain strongly positive with nearly $100B+ in total ETF net assets.
What are Bitcoin’s next key upside targets?
The first major target is the psychological $80,000 level, followed by the 200-day moving average near $82,333.
Why are analysts targeting $100K+ for Bitcoin?
The target is based on historical Bitcoin cycle fractals showing that macro range-low retests are often followed by strong expansion phases. Current projections point toward $100K+ by July–August 2026 if support holds.
The opinions and market insights shared on CoinsProbe represent the views of individual authors based on prevailing market conditions at the time of publication. Cryptocurrency investments carry significant risk and volatility. Readers are encouraged to conduct their own research and seek professional financial advice before making investment decisions. CoinsProbe and its contributors do not accept responsibility for financial losses or decisions made based on published content.
CoinsProbe may publish sponsored articles, affiliate links, or promotional collaborations. All sponsored material is clearly labeled to maintain transparency with our audience. Our editorial decisions remain fully independent, and advertising partnerships do not influence reviews, rankings, or published opinions.
Since 2023, CoinsProbe has delivered reliable insights on cryptocurrency, blockchain, and digital assets. Our content is created by experienced researchers and analysts who follow strict editorial standards focused on accuracy, transparency, and credibility. Every article is carefully reviewed and verified using trusted sources and current market data. We provide unbiased analysis and timely updates covering everything from emerging crypto projects to major industry developments.