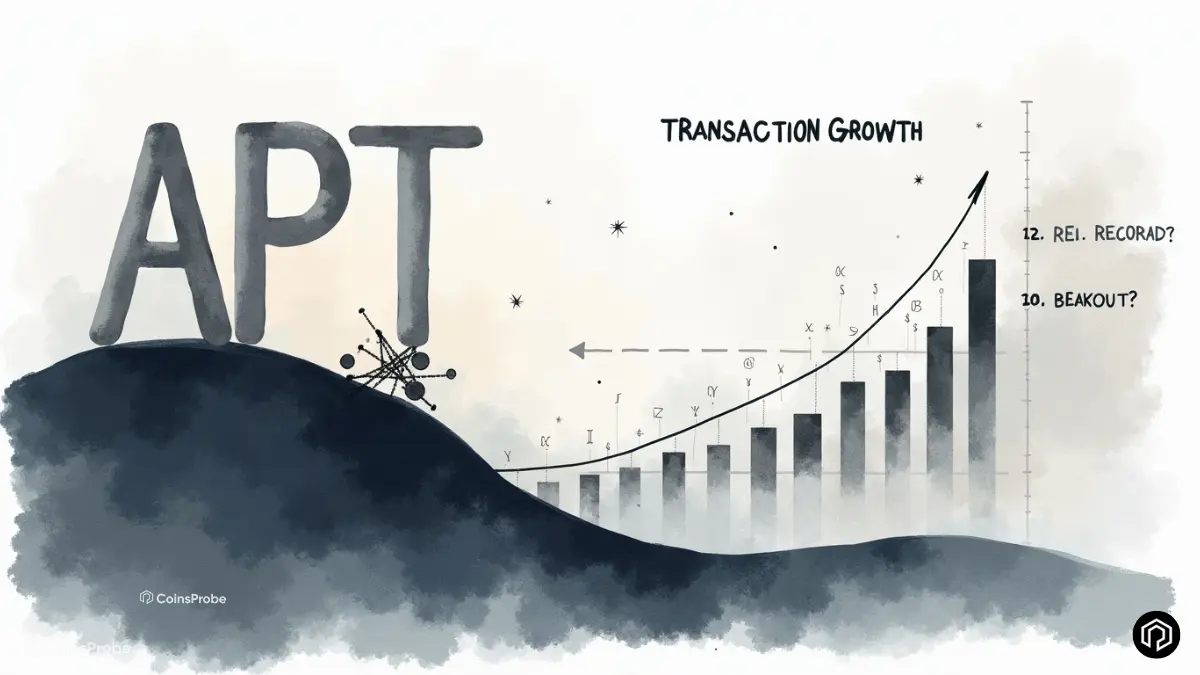

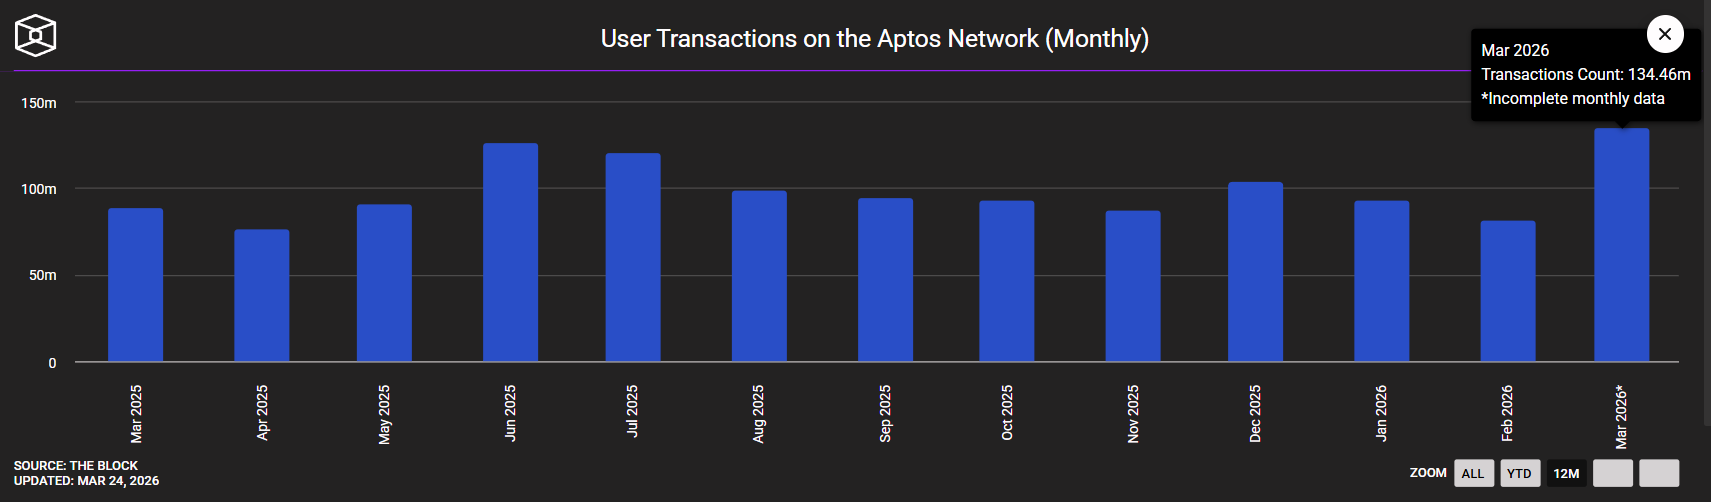
- APT surged 17.21% in 24 hours to trade at $1.07, with the Aptos network recording an all-time high of 134.46 million transactions in March 2026 — surpassing the previous record of 125.62 million set in June 2025.
- A Rounding Bottom pattern is forming on the daily chart, with APT having defended the $0.7897 all-time low as strong support and recently reclaiming the 50-day MA at $0.9725 — signaling active accumulation.
- A sustained close above the 100-day MA at $1.3220 is the next key confirmation level, opening the path toward the $2.01–$2.04 neckline — a decisive breakout above which fully validates the bullish reversal pattern.
- A drop below $0.9055 would weaken the rounding bottom structure and signal that the recovery is losing momentum.
Aptos (APT) is showing renewed signs of life in March 2026, combining a sharp 24-hour price surge with an all-time high in on-chain activity — a rare confluence of technical and fundamental catalysts that is drawing fresh attention to one of the most overlooked Layer-1 networks in the current cycle.
As of March 24, 2026, APT is trading at $1.07, posting an impressive +17.21% gain in the past 24 hours, with a market capitalization of approximately $851.67 million.
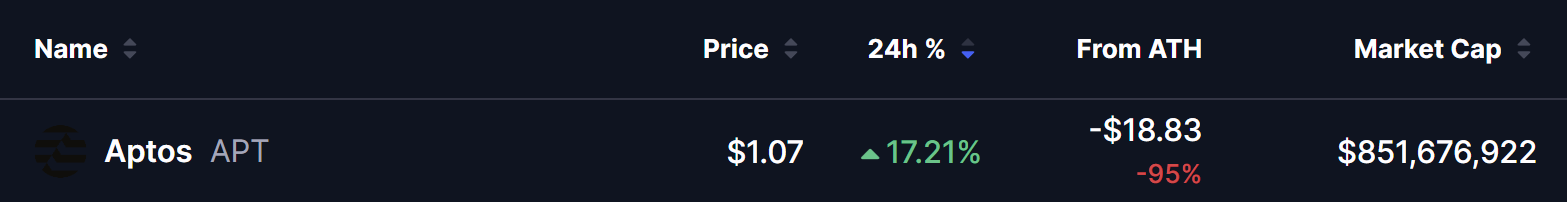
Despite today’s sharp recovery, APT remains approximately 95% below its all-time high — a stark reminder of the extended bear market most altcoins have endured since the 2022–2024 cycle peak. The token’s market capitalization of $851.67 million places it among the more prominent Layer-1 contenders still trading at a fraction of its former highs.
However, the combination of accelerating on-chain activity and an increasingly constructive technical structure suggests that APT may be in the early stages of a meaningful recovery — one backed by real network fundamentals rather than pure speculation.
On-Chain Growth — Record Monthly Transactions
On-chain activity continues to be one of Aptos’ strongest fundamental tailwinds and the most compelling argument for the token’s long-term recovery case.
Over the past 12 months, the Aptos network has demonstrated impressive resilience — with monthly user transactions consistently ranging between 80–120 million even during periods of sustained price weakness. This baseline level of activity reflects genuine network utility rather than price-driven speculation.
March 2026 has now emerged as the strongest month on record. With 134.46 million transactions logged so far on incomplete monthly data, March has already surpassed the previous all-time high of 125.62 million recorded in June 2025 — and the month is not yet complete.
This acceleration in network usage heading into Q2 2026 is significant for several reasons:
Real-world adoption — Transaction growth during a bear market reflects genuine user demand rather than speculative activity. Users and developers are building and transacting on Aptos regardless of token price.
Developer activity — Rising transaction counts signal that developers are actively deploying applications and attracting users to the network — a leading indicator of future demand for APT as a utility token.
Sustained engagement — The consistency of 80–120M monthly transactions across 12 months, now accelerating to 134M, suggests Aptos has established a durable user base that is expanding organically.
APT Technical Analysis — Rounding Bottom Pattern
From a technical perspective, the daily chart is painting an increasingly constructive picture. APT appears to be forming a classic Rounding Bottom — a bullish reversal structure that typically develops after a prolonged downtrend and signals a gradual shift from distribution to accumulation.
How the Pattern Developed:
Rejection at $2.01–$2.04 — Mid-January 2026 APT faced heavy selling pressure near the $2.01–$2.04 neckline zone in mid-January 2026, triggering a sharp multi-week sell-off that extended the downtrend significantly.
All-Time Low at $0.7897 The decline ultimately found a floor at $0.7897 — the all-time low — a level that has since acted as strong support. Multiple successful defenses of this area prevented further downside and allowed the base of the rounding structure to form.
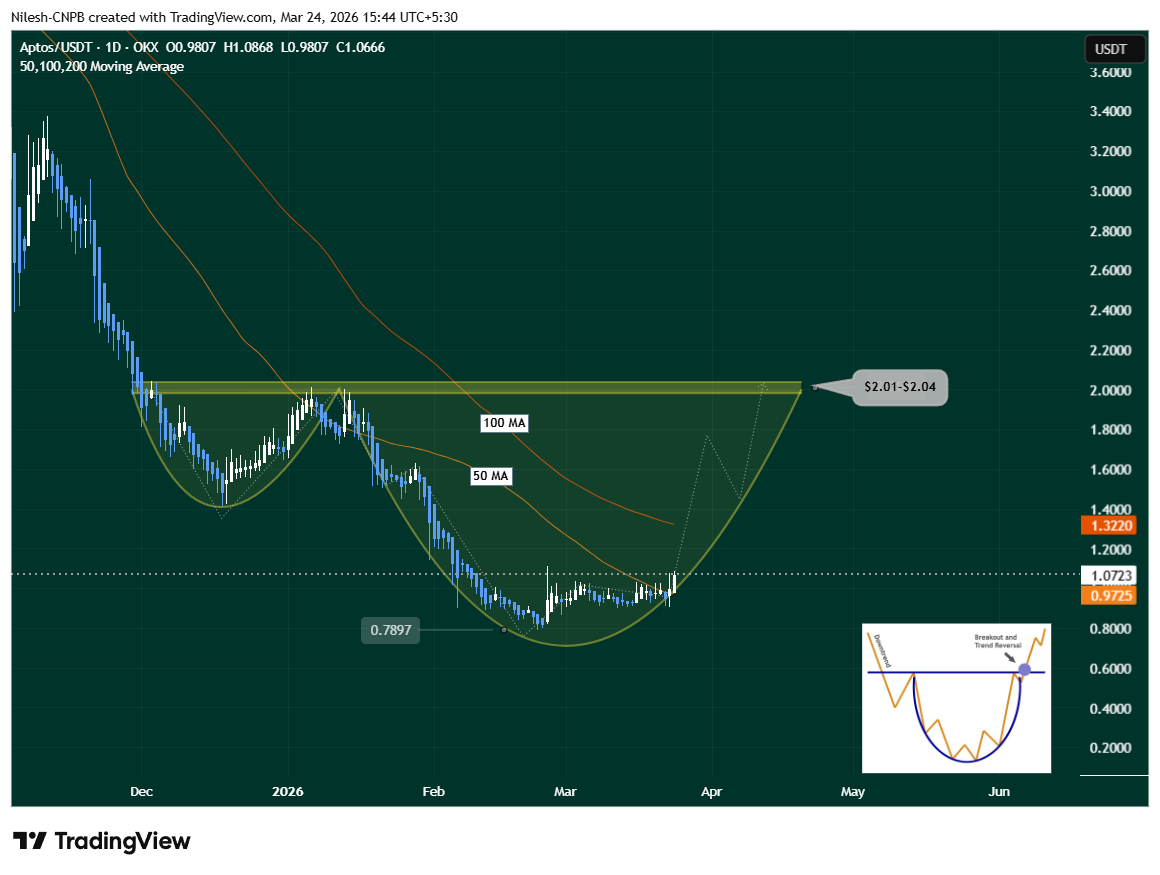
Smooth Arc Recovery Since finding the bottom, price action has begun curving higher in a smooth arc — the defining characteristic of a healthy rounding bottom. Unlike V-shaped recoveries that often fail, the gradual nature of APT’s bottoming process suggests genuine accumulation by patient buyers rather than a short-term speculative bounce.
50-day MA Reclaimed at $0.9725 The recent reclaim of the 50-day moving average near $0.9725 is a meaningful development — confirming that short-term momentum has shifted in favor of buyers and that the accumulation phase may be maturing toward a breakout attempt.
What’s Next for APT?
Key Technical Levels:
$0.9055 — key support. A drop below this level would weaken the rounding bottom structure and signal that the recovery is losing momentum. As long as APT holds above $0.9055 on a closing basis, the broader bullish structure remains intact.
$1.3220 — 100-day MA resistance. The next major confirmation level. A sustained daily close above the 100-day moving average at $1.3220 would mark a clear shift in medium-term momentum — signaling that buyers have regained control after months of corrective price action.
$2.01–$2.04 — Neckline resistance. The upper boundary of the rounding bottom pattern and the most critical level on the chart. A decisive breakout above this zone would fully validate the rounding bottom formation and open the door to a much broader bullish expansion.
Bullish Scenario
APT holds above $0.9055, reclaims the 100-day MA at $1.3220 on a sustained daily close, and builds momentum toward the $2.01–$2.04 neckline. A decisive breakout above the neckline — ideally confirmed with strong volume — would fully validate the rounding bottom and attract momentum traders who have been sidelined during the prolonged downtrend. The measured move from the rounding bottom pattern projects significant upside beyond $2.04 if the breakout confirms.
Bearish Scenario
Failure to hold above $0.9055 on a daily closing basis would weaken the rounding bottom structure materially. A sustained breakdown below this level would signal that the accumulation thesis has failed and that APT needs more time to build a sufficient base — with a potential retest of the $0.7897 all-time low as the worst-case scenario.
Some consolidation or minor pullbacks are possible — and should be expected — particularly as price approaches the 100-day MA at $1.3220. However, as long as higher lows continue to form and the rounded base structure remains intact, the broader bullish case stays valid.
Frequently Asked Questions
Why is Aptos (APT) surging today?
APT posted a 17.21% gain in 24 hours on March 24, 2026, driven by a combination of renewed buying interest in Layer-1 altcoins, the Aptos network recording an all-time high in monthly transactions at 134.46 million, and a technically constructive rounding bottom pattern forming on the daily chart after months of base-building.
What is a Rounding Bottom pattern and why is it bullish?
A Rounding Bottom is a bullish reversal pattern that forms after a prolonged downtrend, characterized by price gradually curving higher in a smooth arc from a low point. It signals a gradual shift from selling pressure to buying accumulation. The pattern is confirmed when price breaks decisively above the neckline resistance — in APT’s case, the $2.01–$2.04 zone.
What is the APT price target from the Rounding Bottom?
For the rounding bottom to be fully confirmed, APT needs a decisive breakout above the $2.01–$2.04 neckline resistance. The path there requires first reclaiming the 100-day MA at $1.3220. A drop below $0.9055 would weaken the pattern, while a break below $0.7897 would invalidate it entirely.
Why does the transaction all-time high matter for APT’s price?
Network transaction growth during a bear market reflects genuine utility demand rather than speculative activity. The record 134.46 million transactions in March 2026 — surpassing the previous high of 125.62 million from June 2025 — signals that real users and developers are actively building on Aptos regardless of token price. This fundamental backdrop strengthens the case for APT’s recovery being sustainable rather than purely momentum-driven.
The opinions and market insights shared on CoinsProbe represent the views of individual authors based on prevailing market conditions at the time of publication. Cryptocurrency investments carry significant risk and volatility. Readers are encouraged to conduct their own research and seek professional financial advice before making investment decisions. CoinsProbe and its contributors do not accept responsibility for financial losses or decisions made based on published content.
CoinsProbe may publish sponsored articles, affiliate links, or promotional collaborations. All sponsored material is clearly labeled to maintain transparency with our audience. Our editorial decisions remain fully independent, and advertising partnerships do not influence reviews, rankings, or published opinions.
Since 2023, CoinsProbe has delivered reliable insights on cryptocurrency, blockchain, and digital assets. Our content is created by experienced researchers and analysts who follow strict editorial standards focused on accuracy, transparency, and credibility. Every article is carefully reviewed and verified using trusted sources and current market data. We provide unbiased analysis and timely updates covering everything from emerging crypto projects to major industry developments.