- TRON (TRX) is trading at $0.3096, up +7.62% over 90 days and +8.93% YTD — outperforming Bitcoin (-21.55% YTD) and Ethereum (-29.83% YTD) by a significant margin.
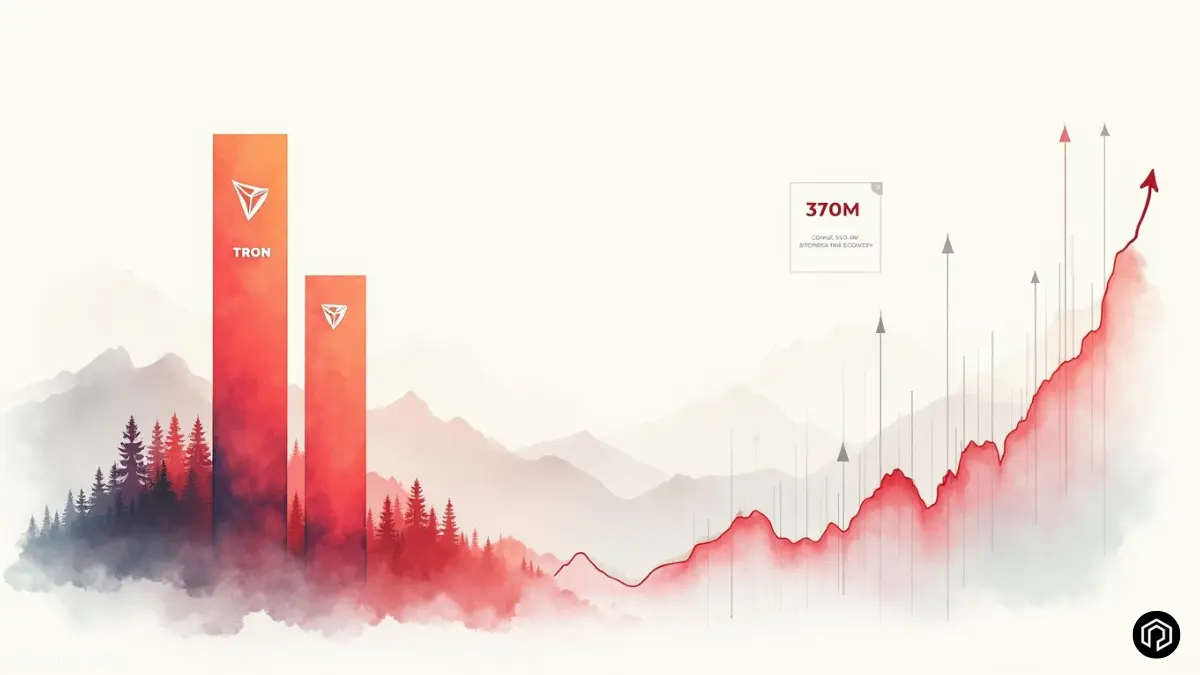
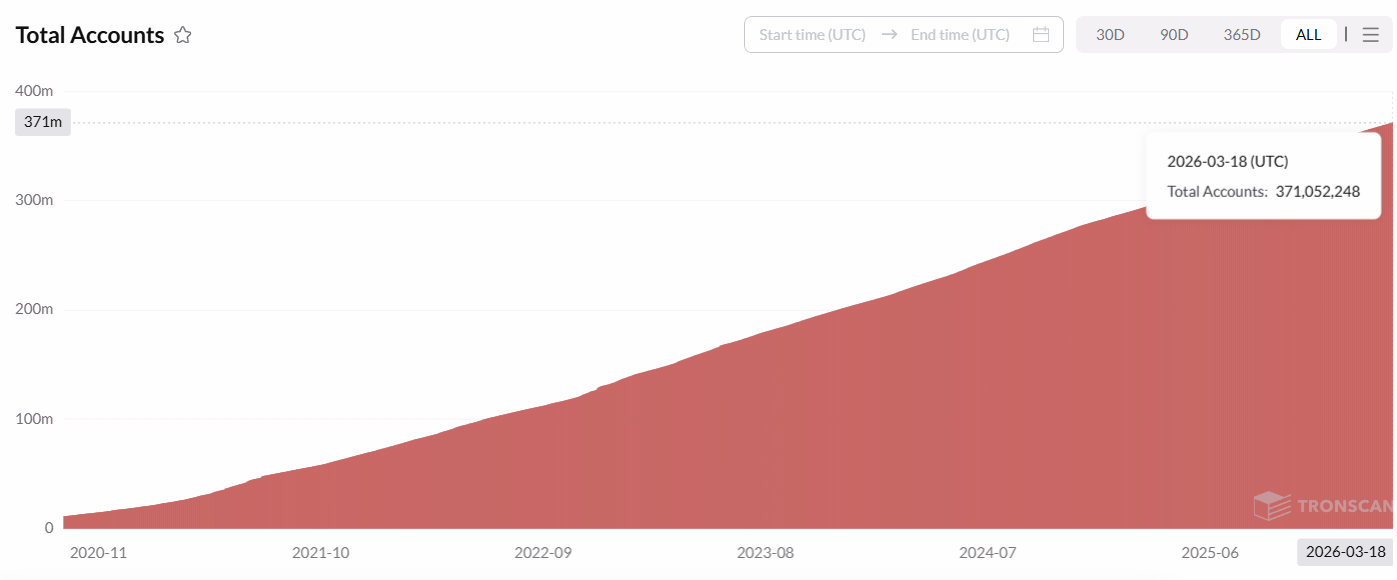
- TRON surpassed 370 million total accounts on March 18, 2026 — TRONSCAN confirms 371,052,248 accounts — one of the largest user bases of any blockchain globally.
- A double bottom (W-shaped) reversal pattern is forming on the weekly chart with two lows near $0.2707, with TRX already reclaiming the 50-week MA at $0.29596.
- Bullish target: $0.37090 (+20%) if TRX breaks above the $0.32082 neckline — Invalidation: close below the 50-week MA.
Amidst one of the most volatile periods for major cryptocurrencies in recent months, TRON (TRX) is standing out as one of the few large-cap assets posting positive returns across multiple timeframes.
As of March 22, 2026, TRX is trading at $0.3096 with a market capitalization of approximately $29.34 billion — keeping it firmly among the top 10 largest cryptocurrencies globally.
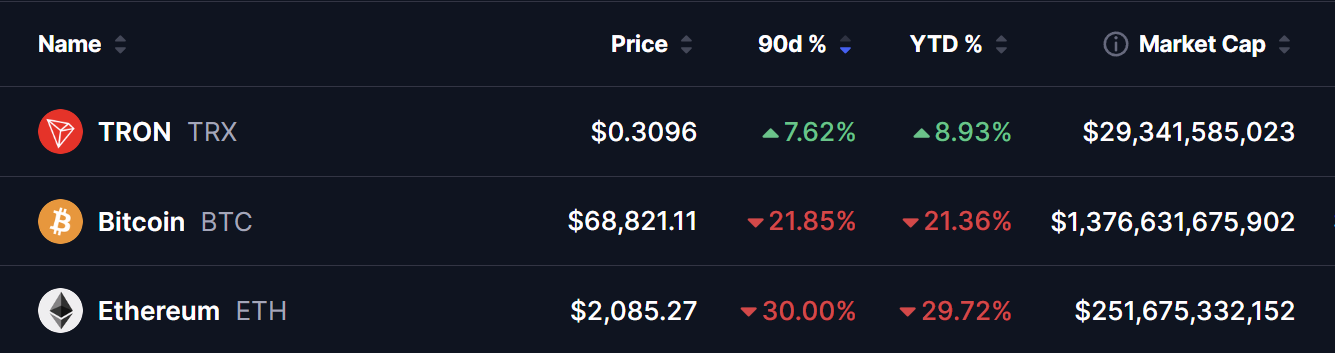
While Bitcoin has shed more than 21% year-to-date and Ethereum has declined nearly 30%, TRX has quietly delivered positive returns on both timeframes. This divergence is not accidental — it reflects TRON’s growing network utility, its dominant position in stablecoin transfers, and an expanding user base that continues to grow regardless of broader market sentiment.
TRX is one of the very few major assets posting gains on both the 90-day and YTD timeframes — a rare combination in the current market environment that underscores genuine network strength rather than speculative momentum.
TRON Surpasses 370 Million Accounts — A Historic Milestone
The fundamental story behind TRX’s outperformance became clearer on March 18, 2026, when TRON DAO officially announced that the network had surpassed 370 million total accounts — a historic milestone that places TRON among the most widely adopted blockchains ever built.
TRONSCAN data confirms the exact figure at 371,052,248 accounts as of March 18, 2026 — with the growth trajectory showing steady acceleration since 2020 and no signs of slowing.
To put this in perspective, 371 million accounts represents a user base comparable to major global financial platforms. The growth has been driven primarily by three use cases where TRON has established genuine dominance:
Stablecoin transfers — TRON is the leading network for USDT transfers globally, processing billions of dollars in daily stablecoin volume at near-zero fees. Merchants, exchanges, and individuals across emerging markets use TRON-based USDT as a primary financial tool.
DeFi activity — TRON’s DeFi ecosystem — including JustLend, SunSwap, and related protocols — has attracted significant total value locked, driven by low transaction costs and high throughput.
Everyday payments — TRON’s sub-cent transaction fees make it one of the few blockchains that is genuinely practical for everyday payment use cases, particularly in regions with limited access to traditional banking infrastructure.
The 370 million account milestone reinforces TRON’s position not as a speculative asset but as operational infrastructure — and that distinction is increasingly reflected in TRX’s price resilience relative to more speculative assets.
Double Bottom Pattern — A Classic Bullish Reversal Signal
Beyond the fundamental picture, TRON’s weekly technical chart is forming one of the most reliable bullish reversal patterns in technical analysis — a double bottom, also known as a W-shaped pattern.
What the Chart Shows
The pattern has developed over approximately three months on the weekly timeframe:
First bottom — December 2025 TRX found support near the $0.2707 level in December 2025 following a broad market correction. Buyers stepped in at this zone, forming the first trough of the W pattern.
Second bottom — February 2026 TRX retested the same $0.2707 support zone in February 2026 — forming the second trough. Critically, the second low held at or near the same level as the first, confirming that buyers are defending this zone with conviction.
50-week MA reclaimed: $0.29596 Following the second bottom, TRX has reclaimed its 50-week moving average at approximately $0.29596 — a significant development that confirms bullish momentum is building above a key dynamic support level.
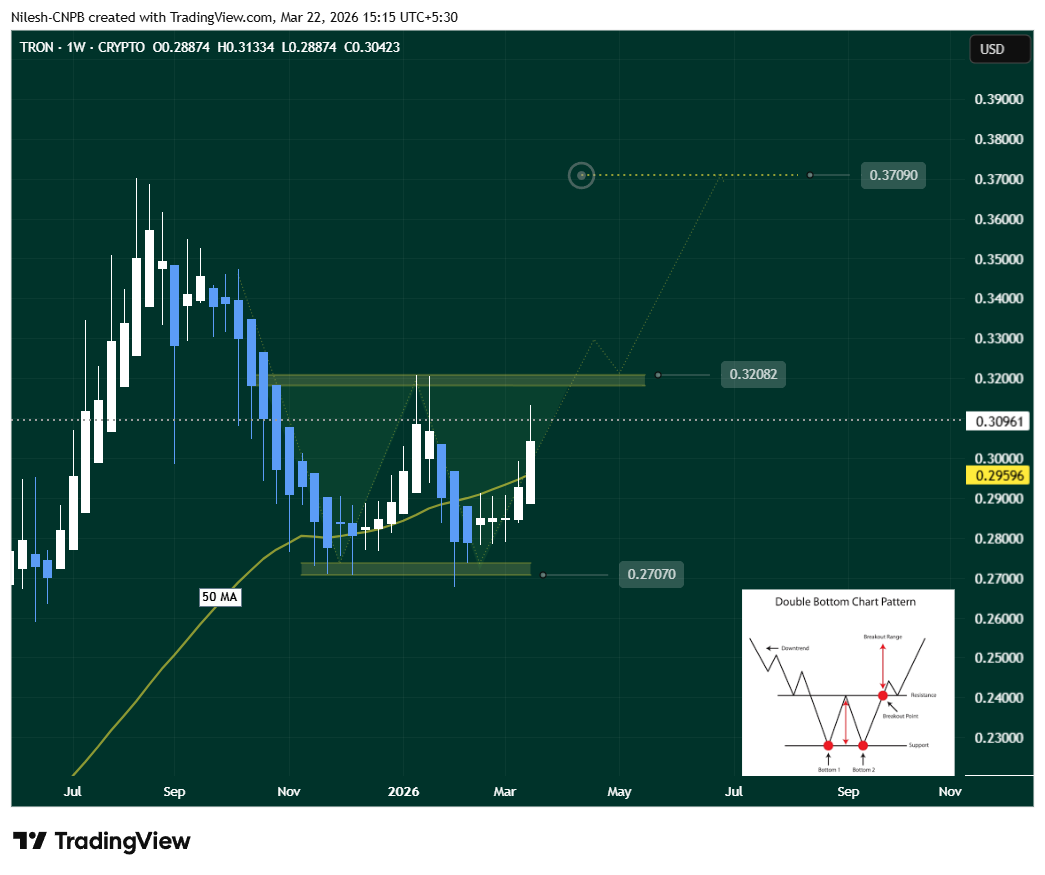
Neckline resistance: $0.32082 The neckline of the double bottom pattern sits at $0.32082 — the local high between the two bottoms. This is the critical level that must be broken for the pattern to be fully confirmed.
Bullish Scenario
If TRX holds above the 50-week MA and breaks decisively above the $0.32082 neckline — ideally with a successful retest of this level as support — it would confirm the double bottom pattern and trigger the measured move target.
- Hold above 50-week MA ($0.29596)
- Break above neckline at $0.32082
- Retest $0.32082 as support (confirmation)
- Target: $0.37090 (+20% from current price)
The $0.37090 measured move target is calculated from the height of the double bottom pattern — the distance from the $0.2707 low to the $0.32082 neckline, projected upward from the breakout point.
Bearish Scenario
- Failure to hold the 50-week MA at $0.29596
- Signals double bottom setup is invalidated
- Could lead to retest of $0.2707 support zone
- Break below $0.2707 = full pattern failure
The invalidation level is clear — a weekly close below the 50-week MA at $0.29596 would indicate that the bullish reversal has failed and further consolidation or downside is likely.
What’s Next for TRX?
TRON is presenting one of the more compelling setups in the current market cycle — combining genuine fundamental growth with a high-probability technical reversal pattern at a time when most major assets are struggling.
The combination of 371 million accounts, stablecoin dominance, positive YTD returns against a negative market, and a textbook double bottom forming on the weekly chart creates a confluence of bullish signals that is difficult to ignore.
The key catalyst to watch is the $0.32082 neckline break. A weekly close above this level with meaningful volume would confirm the double bottom, validate the bullish momentum, and open the door toward the $0.37090 target — a move that would represent a full recovery to TRON’s early 2026 highs.
Until that confirmation arrives, the 50-week MA at $0.29596 remains the floor that bulls must defend on any pullback.
Frequently Asked Questions
Why is TRX outperforming Bitcoin and Ethereum in 2026?
TRX’s outperformance reflects TRON’s growing real-world utility rather than speculative demand. TRON is the dominant network for USDT stablecoin transfers globally — processing billions in daily volume at near-zero fees. This creates consistent demand for TRX (used to pay transaction fees) that is independent of broader crypto market sentiment. With 371 million accounts and growing DeFi activity, TRON’s network usage provides a floor for TRX demand that purely speculative assets lack.
What is the significance of TRON reaching 371 million accounts?
371 million accounts places TRON among the most widely adopted blockchains globally — comparable in scale to major fintech platforms. The milestone reflects genuine adoption driven by stablecoin transfers, DeFi usage, and everyday payments, particularly in emerging markets where low-fee blockchain transactions serve as practical financial infrastructure. This level of real-world adoption distinguishes TRON from blockchains that primarily serve speculative traders.
What is a double bottom pattern and why is it bullish?
A double bottom is a technical reversal pattern that forms when price tests a support level twice — creating two distinct lows at approximately the same price — before recovering. The pattern resembles the letter W on a chart. It signals that sellers have twice attempted to push the price lower and failed both times, indicating that buying pressure at the support level is strong. When price breaks above the neckline (the high between the two lows), it confirms the reversal and triggers a measured move target equal to the height of the pattern.
What is the TRX price target from the double bottom pattern?
The measured move target from the double bottom pattern is $0.37090 — approximately 20% above the current price of $0.3096. This is calculated from the height of the pattern (distance from the $0.2707 low to the $0.32082 neckline) projected upward from the breakout point. The neckline at $0.32082 must be broken and retested as support for the target to come into play. Invalidation occurs on a weekly close below the 50-week MA at $0.29596.
What makes TRON dominant in stablecoin transfers?
TRON’s dominance in stablecoin transfers — particularly USDT — stems from its combination of extremely low transaction fees (often less than $1), high throughput (2,000+ transactions per second), and early mover advantage as Tether’s primary network for USDT issuance. For users in emerging markets, exchanges, and payment platforms that process high volumes of stablecoin transactions, TRON offers a cost-effective alternative to Ethereum’s higher gas fees. This has created a self-reinforcing network effect where TRON’s stablecoin volume continues to grow regardless of TRX price movements.
The opinions and market insights shared on CoinsProbe represent the views of individual authors based on prevailing market conditions at the time of publication. Cryptocurrency investments carry significant risk and volatility. Readers are encouraged to conduct their own research and seek professional financial advice before making investment decisions. CoinsProbe and its contributors do not accept responsibility for financial losses or decisions made based on published content.
CoinsProbe may publish sponsored articles, affiliate links, or promotional collaborations. All sponsored material is clearly labeled to maintain transparency with our audience. Our editorial decisions remain fully independent, and advertising partnerships do not influence reviews, rankings, or published opinions.
Since 2023, CoinsProbe has delivered reliable insights on cryptocurrency, blockchain, and digital assets. Our content is created by experienced researchers and analysts who follow strict editorial standards focused on accuracy, transparency, and credibility. Every article is carefully reviewed and verified using trusted sources and current market data. We provide unbiased analysis and timely updates covering everything from emerging crypto projects to major industry developments.