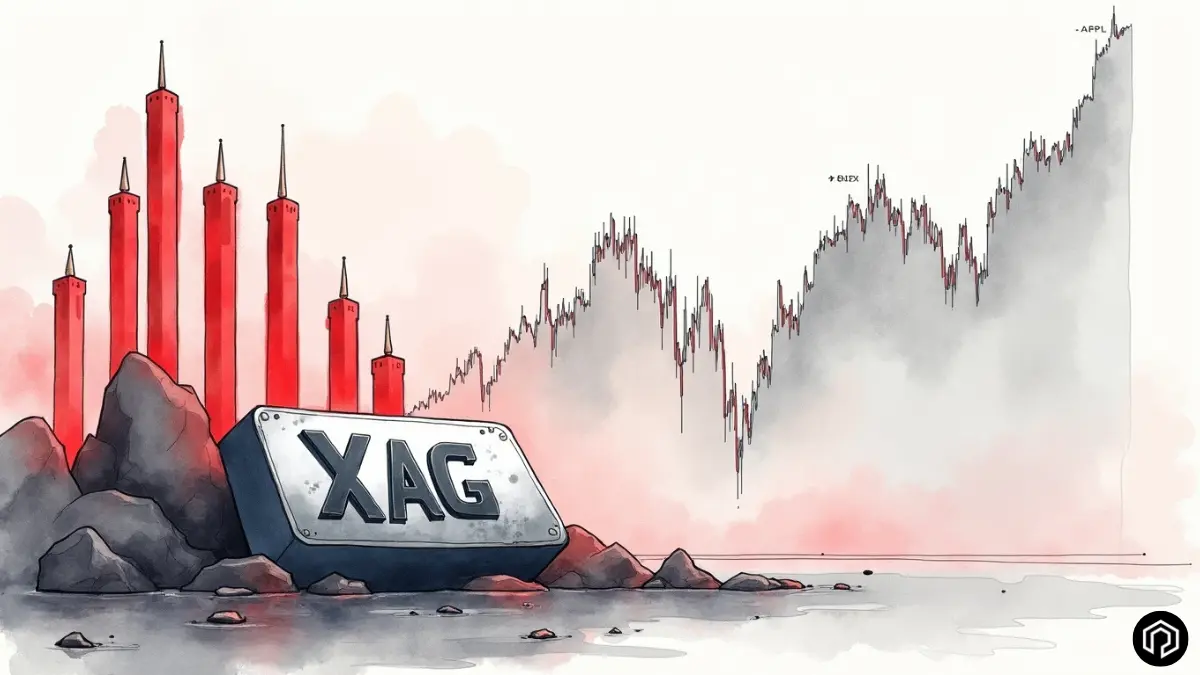

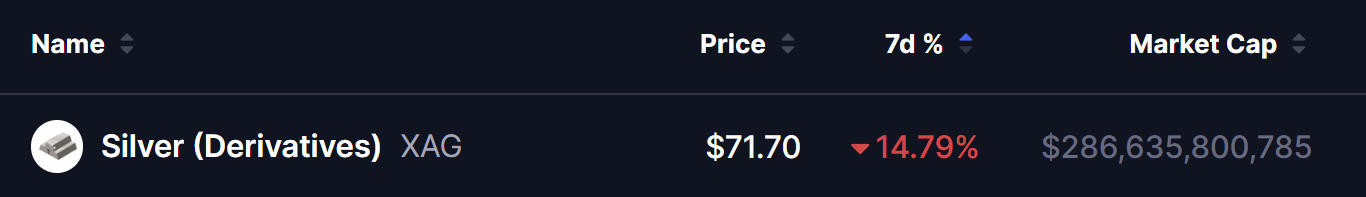
- Silver (XAG) is trading at $71.70, down 14.79% over the past 7 days — one of the sharpest weekly pullbacks in recent months.
- XAG's current price structure closely mirrors Apple's (AAPL) November 2020 consolidation pattern — which preceded a powerful breakout to new highs.
- Current price sits near the $65.58 support level — a critical zone that must hold to keep the bullish fractal intact.
- Invalidation level: $64.14 — a daily close below this level cancels the bullish setup entirely.
- If the fractal plays out, Silver's next targets are $96.39, $121.62 (Fibonacci 1), and $131.10 (Fibonacci 1.13 extension).
Silver (XAG) is currently trading at $71.70 as of March 20, 2026, with a derivatives market capitalization of approximately $286.6 billion — reflecting silver’s position as one of the most actively traded commodities globally across both traditional and crypto markets.
The metal has declined a sharp 14.79% over the past 7 days, making it one of the worst-performing major assets in the current week. The pullback comes after silver surged aggressively earlier in 2026, reaching a high near $121.62 — its Fibonacci 1 level — driven by a combination of geopolitical safe-haven demand from the ongoing US-Israel-Iran conflict and surging industrial demand tied to the global green energy transition.
Despite the steep short-term correction, silver remains in a structurally strong position on the longer-term chart. The current pullback has brought price back toward a significant demand zone — and a compelling historical fractal is now forming that mirrors one of Apple Inc.’s most powerful pre-breakout consolidation phases.
The Apple 2020 Fractal — A Powerful Historical Parallel
The most compelling technical development in silver’s current setup is a striking structural similarity between its price action and Apple Inc. (AAPL) during November 2020 — a period that preceded one of Apple’s most explosive breakout moves.
The side-by-side comparison reveals the following parallels:
Apple — November 2020:
- Price surged to a high then entered a controlled consolidation
- Pulled back toward the $89.15 base level (Fibonacci 0)
- Consolidated between $110–$138 for several weeks
- Eventually broke above $137.98 (Fibonacci 1) with strong momentum
- Extended to $144.33 (Fibonacci 1.13 extension) — a 13% move above the prior high
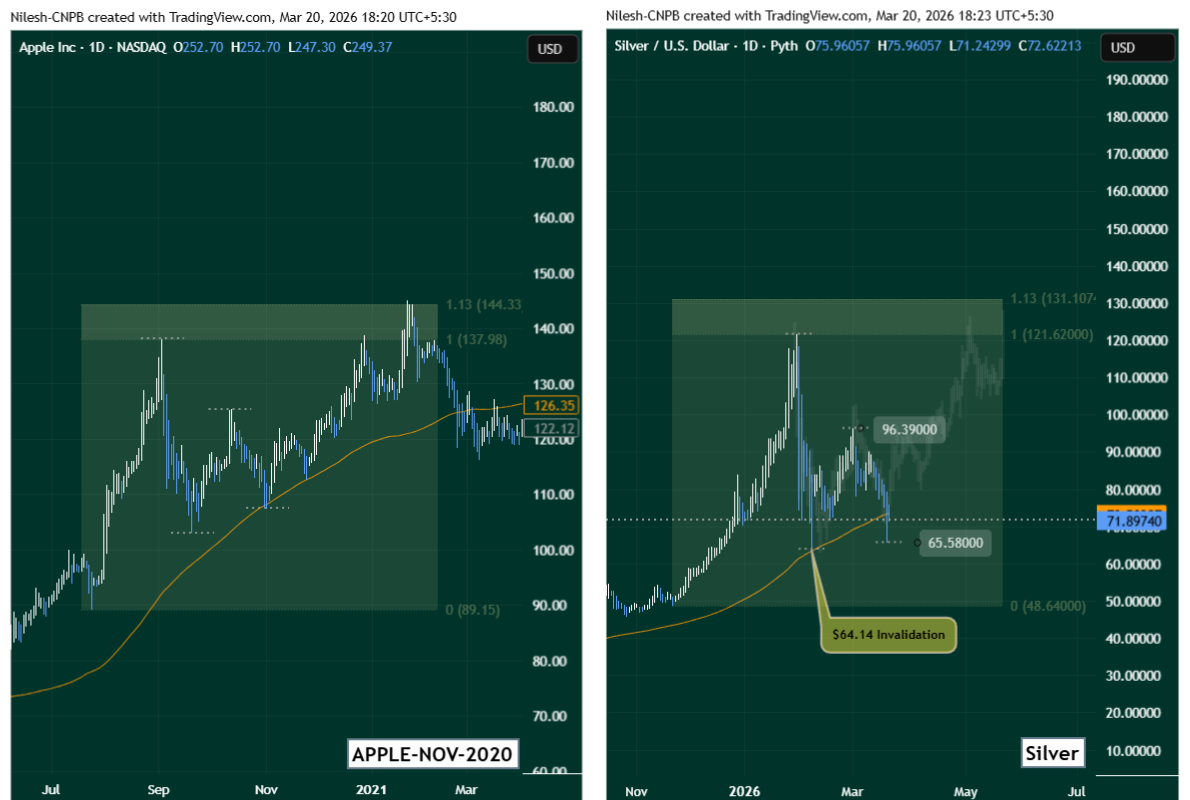
Silver (XAG) — Current (March 2026):
- Price surged to a high near $121.62 then pulled back sharply
- Fibonacci 0 base sits at $48.64 — the launch point of the rally
- Currently trading near $71.70 — pulling back toward the $65.58 support zone
- $121.62 (Fibonacci 1) is the key breakout level to reclaim
- If the fractal holds, the 1.13 Fibonacci extension projects to $131.10 — a new all-time high for silver
The structural similarity between both charts is notable — the same Fibonacci ratios, the same consolidation behavior after an initial surge, and the same accumulation dynamic before a potential breakout. Apple’s 2020 pattern ultimately resolved to the upside with a clean extension beyond the prior high. Silver’s fractal suggests a similar resolution is possible if key support levels hold.
It is important to note that fractals are probabilistic frameworks, not guarantees. Silver is a physical commodity with different demand drivers than a tech stock — including industrial demand, geopolitical safe-haven flows, and currency dynamics. Confirmation requires price action to follow through at each level.
What’s Next for Silver (XAG)?
Silver sits at a critical decision point after its sharpest weekly decline in recent months. The next few weekly candles will determine whether the Apple fractal continues to play out — or whether the breakdown accelerates further.
Bullish Scenario
For the bullish fractal to remain valid and ultimately play out, silver needs to accomplish the following in sequence:
Step 1 — Hold above $64.14 and $65.58 support. These two levels form the foundation of the current structure. The $65.58 level is the immediate support zone visible on the chart, while $64.14 is the hard invalidation level. As long as silver maintains daily closes above both levels, the Apple fractal comparison remains valid and the consolidation is healthy rather than a breakdown.
Step 2 — Reclaim the 100 MA at $73.50. The 100-day moving average — currently sitting just above current price levels at $73.50— is the first meaningful recovery confirmation. A sustained daily close above the 100 MA would signal that buyers have regained control and mirror Apple’s reclaim of its moving average during the 2020 accumulation phase before its breakout.
Step 3 — Break above $96.39 then $121.62. The $96.39 level is the mid-range resistance — the first significant hurdle on the recovery path. A break and hold above this level would open the door toward $121.62 — the Fibonacci 1 level equivalent to Apple’s prior high breakout point. A weekly close above $121.62 would be the critical confirmation that the fractal is fully playing out, opening the door to the $131.10 Fibonacci 1.13 extension — a new all-time high for silver.
The broader macro environment continues to support silver’s long-term demand. The ongoing US-Israel-Iran conflict has disrupted global energy supply chains, indirectly boosting industrial metal demand. Additionally, silver’s critical role in solar panel manufacturing, EV batteries, and semiconductor production provides structural demand tailwinds that gold does not share — giving silver a higher-beta upside profile during commodity bull markets.
Bearish Scenario
If silver fails to hold the current support zone, the picture changes significantly.
A daily close below $64.14 would invalidate the Apple fractal setup entirely. This level is clearly marked on the chart as the invalidation point and represents the threshold below which the current consolidation structure breaks down. A confirmed break below $64.14 would suggest the pullback has extended beyond a normal retracement and that deeper support levels are in play.
In this scenario, the next meaningful support would be found near the $48.64 Fibonacci 0 base level — the original launch point of the rally — representing a further significant decline from current prices. The bearish case would be reinforced by any de-escalation in Middle East tensions, a sharp recovery in the US dollar, or a broader risk-off move that reduces industrial commodity demand.
Frequently Asked Questions
What is Silver (XAG) and how is it traded in crypto markets?
XAG is the internationally recognized ticker symbol for silver, derived from the Latin word Argentum. In crypto markets, silver is traded primarily through perpetual futures contracts (XAGUSDT) on platforms like Binance and Bybit, through Hyperliquid’s HIP-3 permissionless perpetuals (xyz:SILVER), and through physically-backed spot tokens like Kinesis Silver (KAG). It is one of the most liquid commodity derivatives in both traditional and crypto markets.
Why is silver down 14.79% this week?
Silver’s sharp weekly decline reflects a combination of profit-taking after its earlier surge toward $121.62, broader commodity market volatility tied to shifting geopolitical risk sentiment, and dollar strength impacting precious metal prices. Short-term corrections of this magnitude are not unusual for silver, which historically exhibits higher volatility than gold due to its dual role as both a safe-haven asset and an industrial metal.
Why is the Apple 2020 fractal relevant for Silver?
Both Apple in November 2020 and Silver currently share a similar structural pattern at the same Fibonacci ratios — an initial surge to a high, followed by a controlled pullback into a consolidation zone. Apple’s fractal ultimately resolved to a breakout 13% above the prior high (Fibonacci 1.13 extension). If Silver follows the same structure, the equivalent target would be $131.10 — a new all-time high.
What is the $64.14 invalidation level?
The $64.14 level represents the point at which the current consolidation structure breaks down. A daily close below this level would suggest the pullback is not a normal retracement but a deeper correction — invalidating the Apple fractal thesis and pointing toward the $48.64 Fibonacci 0 base as the next major support.
What macro factors support silver’s long-term outlook?
Several structural factors support silver demand beyond geopolitical safe-haven flows: the global green energy transition requires massive silver inputs for solar panels and EV batteries, AI data center buildout increases semiconductor demand (which uses silver), and central bank diversification away from dollar assets boosts precious metal demand broadly. These industrial tailwinds give silver a stronger long-term demand case than gold alone.
The opinions and market insights shared on CoinsProbe represent the views of individual authors based on prevailing market conditions at the time of publication. Cryptocurrency investments carry significant risk and volatility. Readers are encouraged to conduct their own research and seek professional financial advice before making investment decisions. CoinsProbe and its contributors do not accept responsibility for financial losses or decisions made based on published content.
CoinsProbe may publish sponsored articles, affiliate links, or promotional collaborations. All sponsored material is clearly labeled to maintain transparency with our audience. Our editorial decisions remain fully independent, and advertising partnerships do not influence reviews, rankings, or published opinions.
Since 2023, CoinsProbe has delivered reliable insights on cryptocurrency, blockchain, and digital assets. Our content is created by experienced researchers and analysts who follow strict editorial standards focused on accuracy, transparency, and credibility. Every article is carefully reviewed and verified using trusted sources and current market data. We provide unbiased analysis and timely updates covering everything from emerging crypto projects to major industry developments.